PeakLab v1 Documentation Contents AIST Software Home AIST Software Support
Statistical Functions
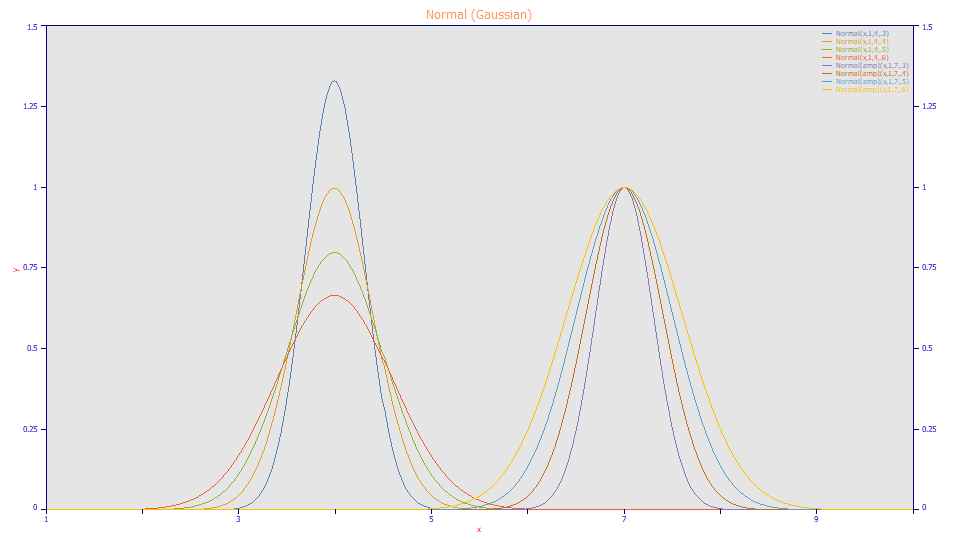
Normal (Gaussian)
a0 = Area
a1 = Center (mean)
a2 = Width (SD)
Built in model: Normal
User-defined peaks and view functions: Normal(x,a0,a1,a2)
Normal (Gaussian) Amplitude
a0 = Amplitude
a1 = Center (mean)
a2 = Width (SD)
Built in model: Normal[amp]
User-defined peaks and view functions: Normal[amp](x,a0,a1,a2)
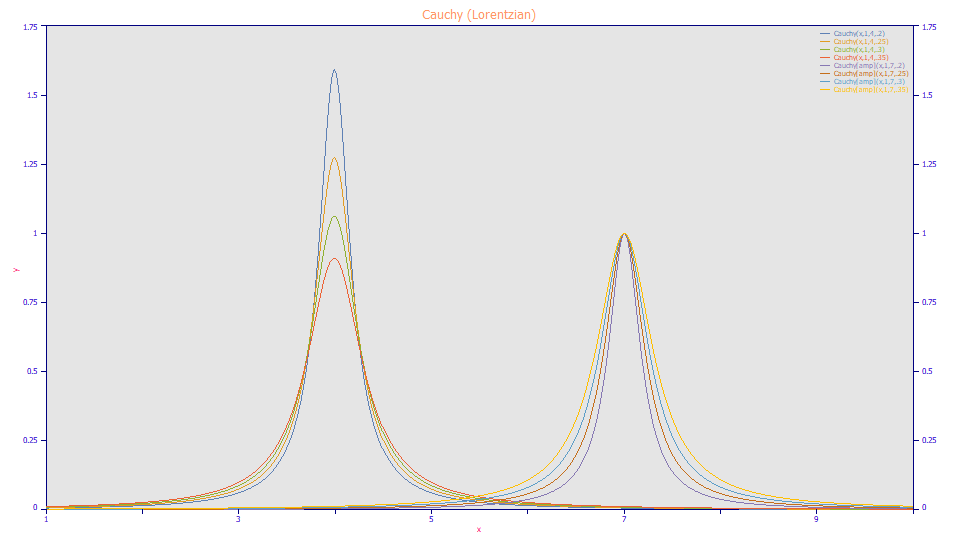
Cauchy (Lorentzian)
a0 = Area
a1 = Center
a2 = Width
Built in model: Cauchy
User-defined peaks and view functions: Cauchy(x,a0,a1,a2)
Cauchy (Lorentzian) Amplitude
a0 = Amplitude
a1 = Center
a2 = Width
Built in model: Cauchy[amp]
User-defined peaks and view functions: Cauchy[amp](x,a0,a1,a2)
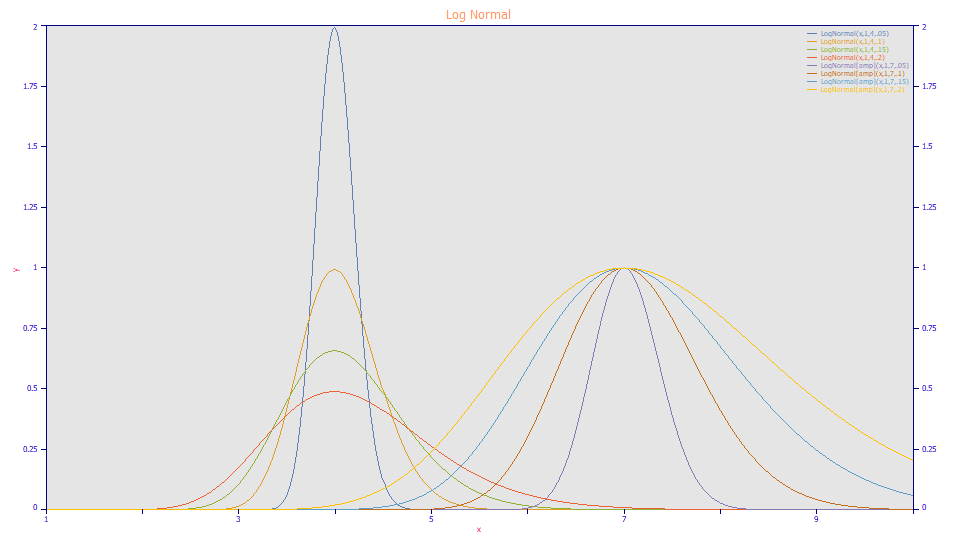
Log Normal
a0 = Area
a1 = Center (¹0)
a2 = Width (>0)
Built in model: LogNormal
User-defined peaks and view functions: LogNormal(x,a0,a1,a2)
Log Normal Amplitude
a0 = Amplitude
a1 = Center (¹0)
a2 = Width (>0)
Built in model: LogNormal[amp]
User-defined peaks and view functions: LogNormal[amp](x,a0,a1,a2)
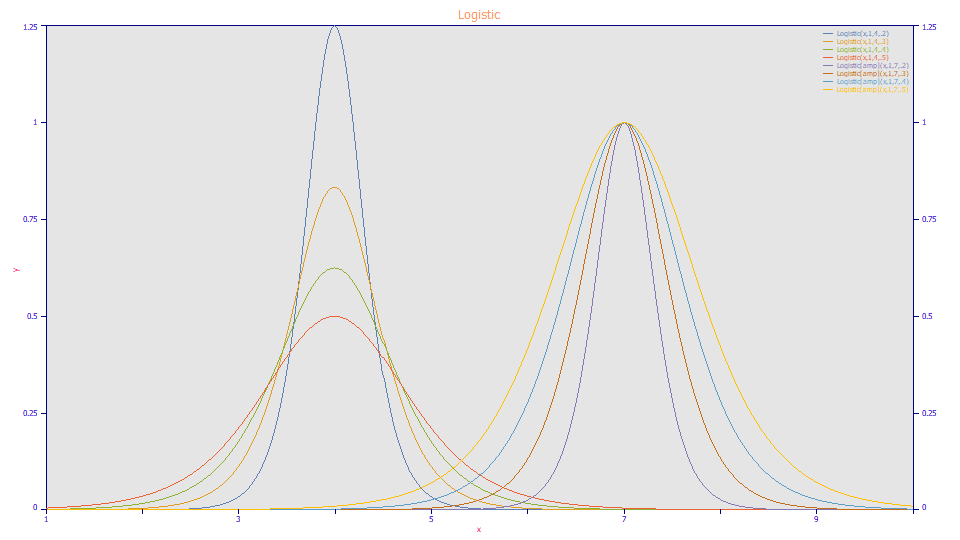
Logistic
a0 = Area
a1 = Center
a2 = Width
Built in model: Logistic
User-defined peaks and view functions: Logistic(x,a0,a1,a2)
Logistic Amplitude
a0 = Amplitude
a1 = Center
a2 = Width
Built in model: Logistic[amp]
User-defined peaks and view functions: Logistic[amp](x,a0,a1,a2)
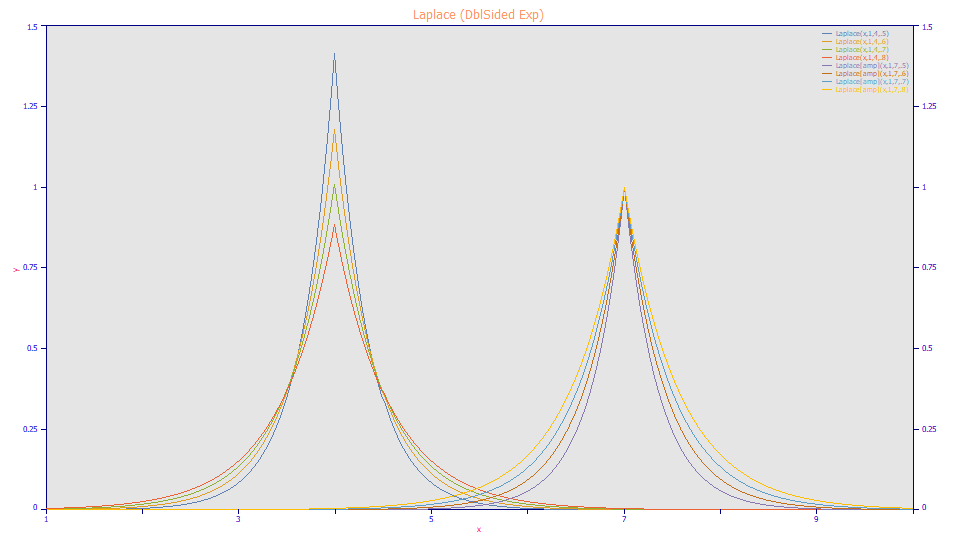
Laplace (DblSided Exp)
a0 = Area
a1 = Center
a2 = Width
Built in model: Laplace
User-defined peaks and view functions: Laplace(x,a0,a1,a2)
Laplace (DblSided Exp) Amplitude
a0 = Amplitude
a1 = Center
a2 = Width
Built in model: Laplace[amp]
User-defined peaks and view functions: Laplace[amp](x,a0,a1,a2)
Extreme Value
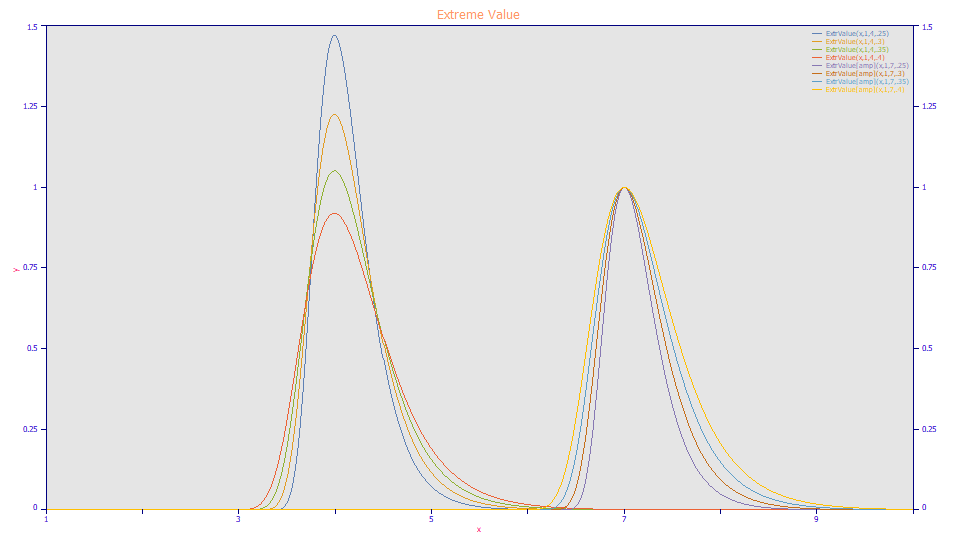
a0 = Area
a1 = Center
a2 = Width (>0)
Built in model: ExtrValue
User-defined peaks and view functions: ExtrValue(x,a0,a1,a2)
Extreme Value Amplitude
a0 = Amplitude
a1 = Center
a2 = Width (>0)
Built in model: ExtrValue[amp]
User-defined peaks and view functions: ExtrValue[amp](x,a0,a1,a2)
Gamma Peak
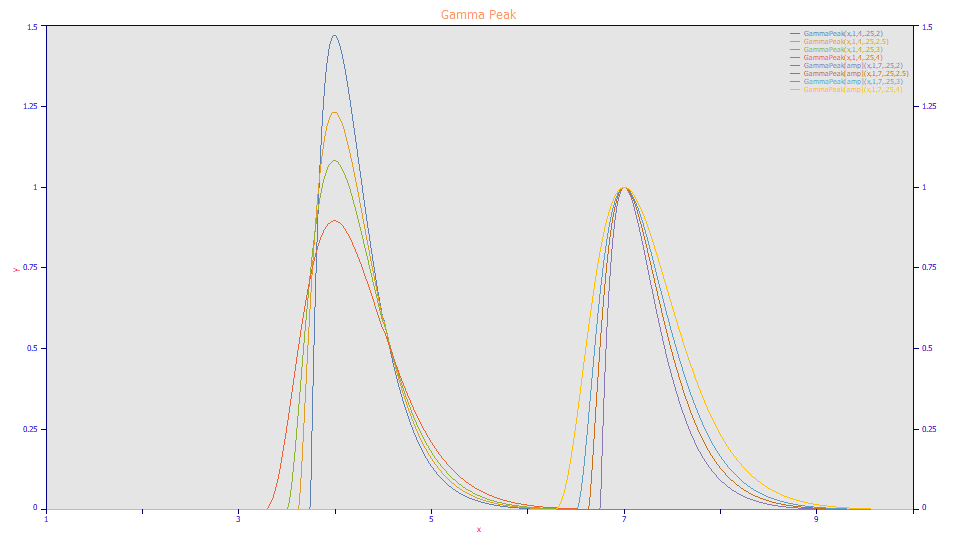
a0 = Area
a1 = Center
a2 = Width (>0)
a3 = Shape (1.01<a3<167.92)
Built in model: GammaPeak
User-defined peaks and view functions: GammaPeak(x,a0,a1,a2,a3)
Gamma Peak Amplitude
a0 = Amplitude
a1 = Center
a2 = Width (>0)
a3 = Shape (1.01<a3<167.92)
Built in model: GammaPeak[amp]
User-defined peaks and view functions: GammaPeak[amp](x,a0,a1,a2,a3)
Inverted Gamma Peak
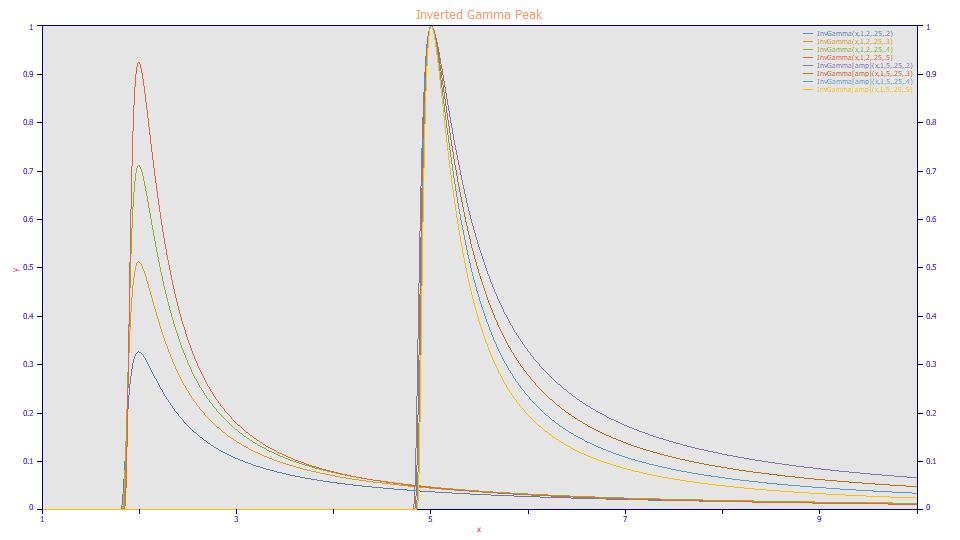
a0 = Area
a1 = Center
a2 = Width (>0)
a3 = Shape (0<a3<167.92)
Built in model: InvGamma
User-defined peaks and view functions: InvGamma(x,a0,a1,a2,a3)
Inverted Gamma Peak Amplitude
a0 = Amplitude
a1 = Center
a2 = Width (>0)
a3 = Shape (0<a3<167.92)
Built in model: InvGamma[amp]
User-defined peaks and view functions: InvGamma[amp](x,a0,a1,a2,a3)
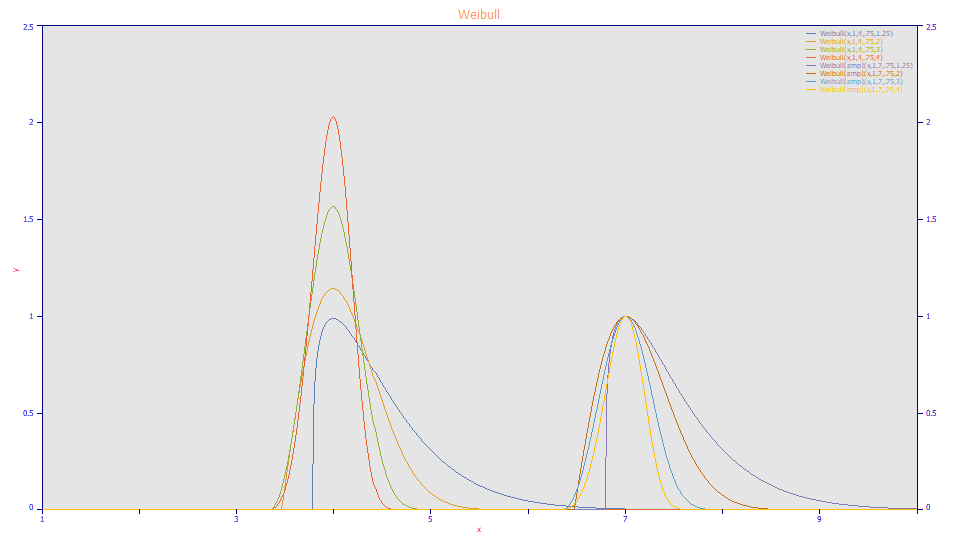
Weibull
a0 = Area
a1 = Center
a2 = Width (>0)
a3 = Shape (>1.01)
Built in model: Weibull
User-defined peaks and view functions: Weibull(x,a0,a1,a2,a3)
Weibull Amplitude
a0 = Amplitude
a1 = Center
a2 = Width (>0)
a3 = Shape (>1.01)
Built in model: Weibull[amp]
User-defined peaks and view functions: Weibull[amp](x,a0,a1,a2,a3)
Error
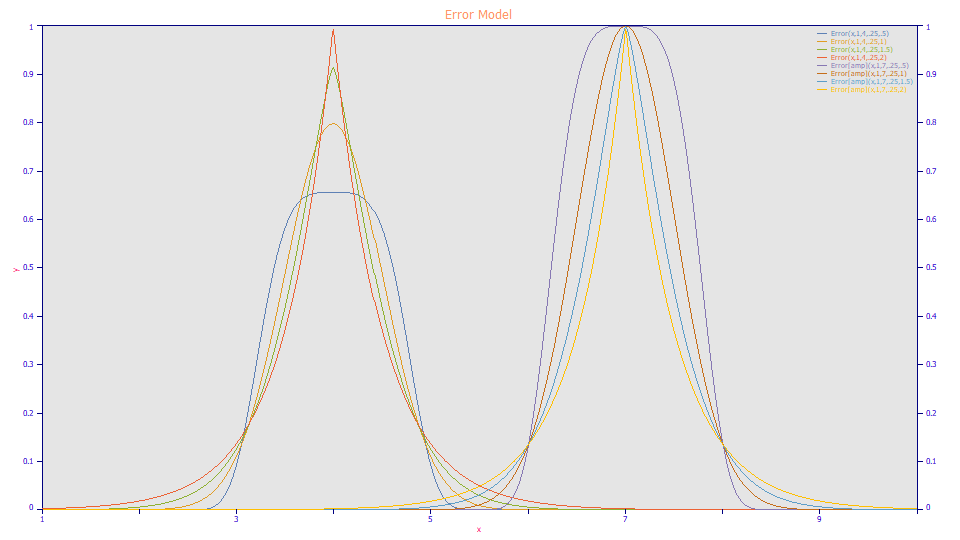
a0 = Area
a1 = Center
a2 = Width (>0)
a3 = Shape (>0)
Built in model: Error
User-defined peaks and view functions: Error(x,a0,a1,a2,a3)
Error Amplitude
a0 = Amplitude
a1 = Center
a2 = Width (>0)
a3 = Shape (>0)
Built in model: Error[amp]
User-defined peaks and view functions: Error[amp](x,a0,a1,a2,a3)
Chi Squared
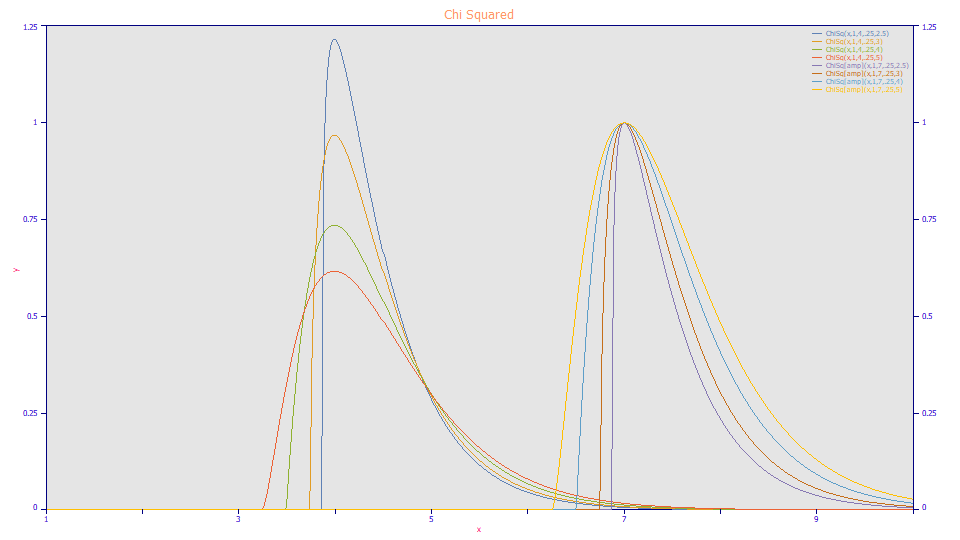
a0 = Area
a1 = Center
a2 = Width (>0)
a3 = Shape (2.01<a3<335.84)
Built in model: ChiSq
User-defined peaks and view functions: ChiSq(x,a0,a1,a2,a3)
Chi Squared Amplitude
a0 = Amplitude
a1 = Center
a2 = Width (>0)
a3 = Shape (2.01<a3<335.84)
Built in model: ChiSq[amp]
User-defined peaks and view functions: ChiSq[amp](x,a0,a1,a2,a3)
Student's t
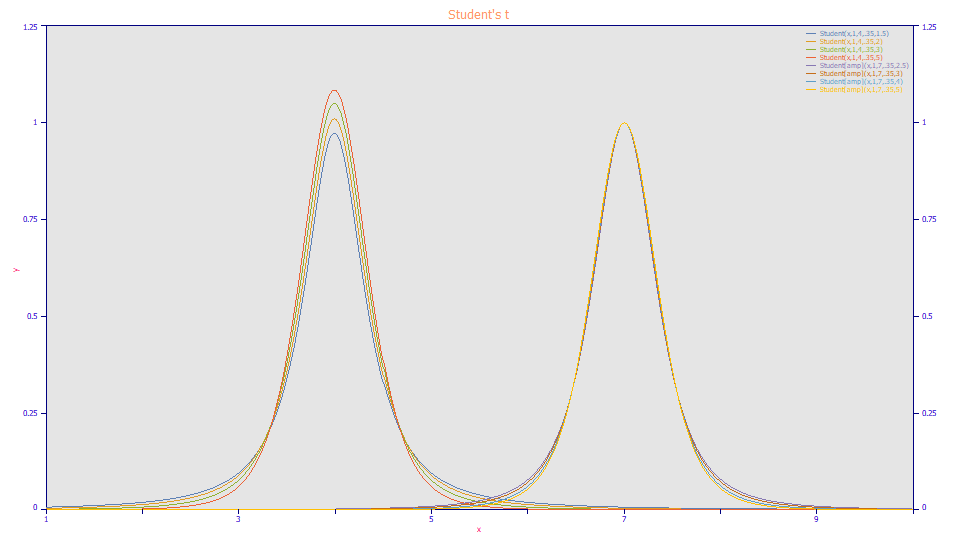
a0 = Area
a1 = Center
a2 = Width (>0)
a3 = Shape (>0)
Built in model: Student
User-defined peaks and view functions: Student(x,a0,a1,a2,a3)
Student's t Amplitude
a0 = Amplitude
a1 = Center
a2 = Width (>0)
a3 = Shape (>0)
Built in model: Student[amp]
User-defined peaks and view functions: Student[amp](x,a0,a1,a2,a3)
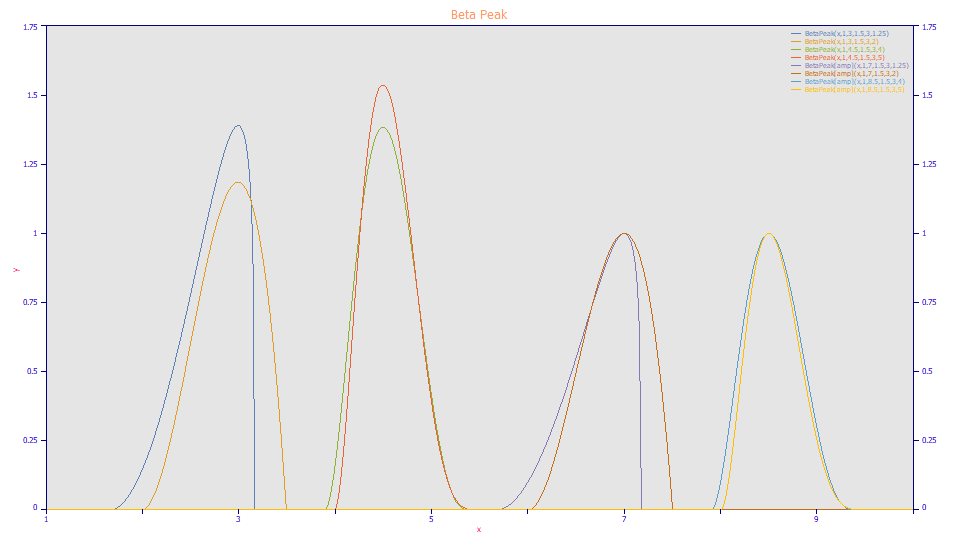
Beta Peak
a0 = Area
a1 = Center
a2 = Width (>0)
a3 = Shape1 (1.01)
a4 = Shape2 (1.01)
Built in model: BetaPeak
User-defined peaks and view functions: BetaPeak(x,a0,a1,a2,a3,a4)
Beta Peak Amplitude
a0 = Amplitude
a1 = Center
a2 = Width (>0)
a3 = Shape1 (1.01)
a4 = Shape2 (1.01)
Built in model: BetaPeak[amp]
User-defined peaks and view functions: BetaPeak[amp](x,a0,a1,a2,a3,a4)
F Variance
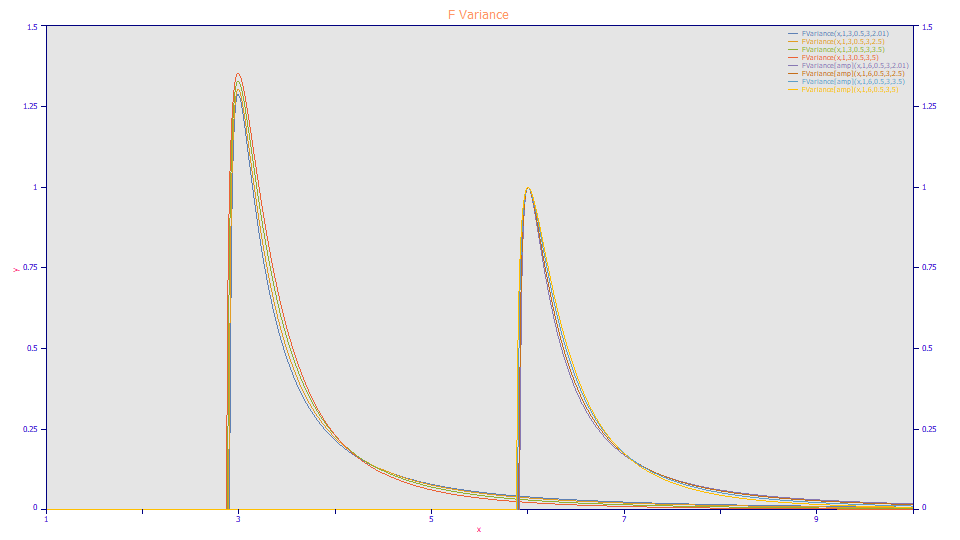
a0 = Area
a1 = Center
a2 = Width (>0)
a3 = Shape1 (2<a3<167.92)
a4 = Shape2 (2<a4<167.92)
Built in model: FVariance
User-defined peaks and view functions: FVariance(x,a0,a1,a2,a3,a4)
FVariance Amplitude
a0 = Amplitude
a1 = Center
a2 = Width (>0)
a3 = Shape1 (2<a3<167.92)
a4 = Shape2 (2<a4<167.92)
Built in model: FVariance[amp]
User-defined peaks and view functions: FVariance[amp](x,a0,a1,a2,a3,a4)
Pearson VII
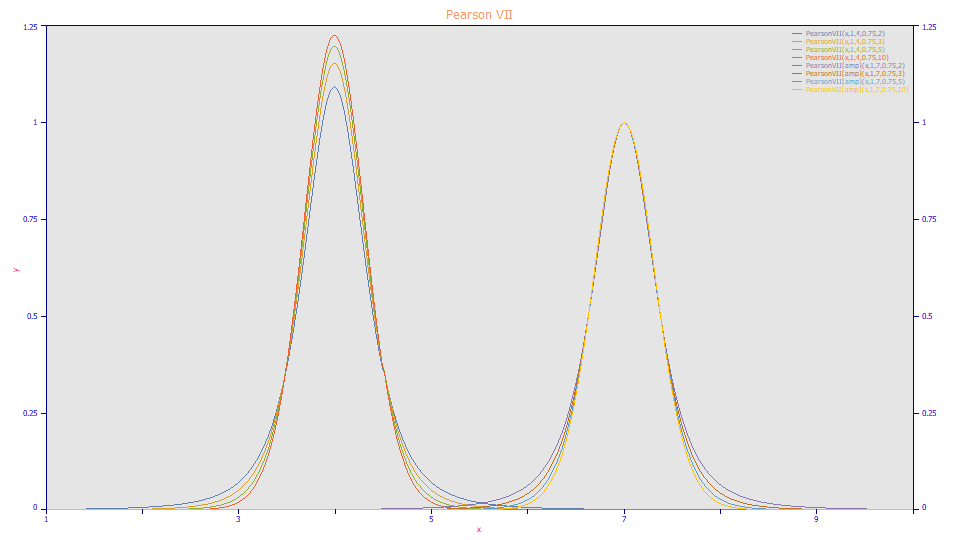
a0 = Area
a1 = Center (mode)
a2 = FWHM
a3 = Shape (1=Lorentzian, infinity=Gaussian)
Built in model: PearsonVII
User-defined peaks and view functions: PearsonVII(x,a0,a1,a2,a3)
Pearson VII (Amplitude)
a0 = Amplitude
a1 = Center (mode)
a2 = FWHM
a3 = Shape (1=Lorentzian, infinity=Gaussian)
Built in model:PearsonVII[amp]
User-defined peaks and view functions: PearsonVII[amp](x,a0,a1,a2,a3)
Pearson IV
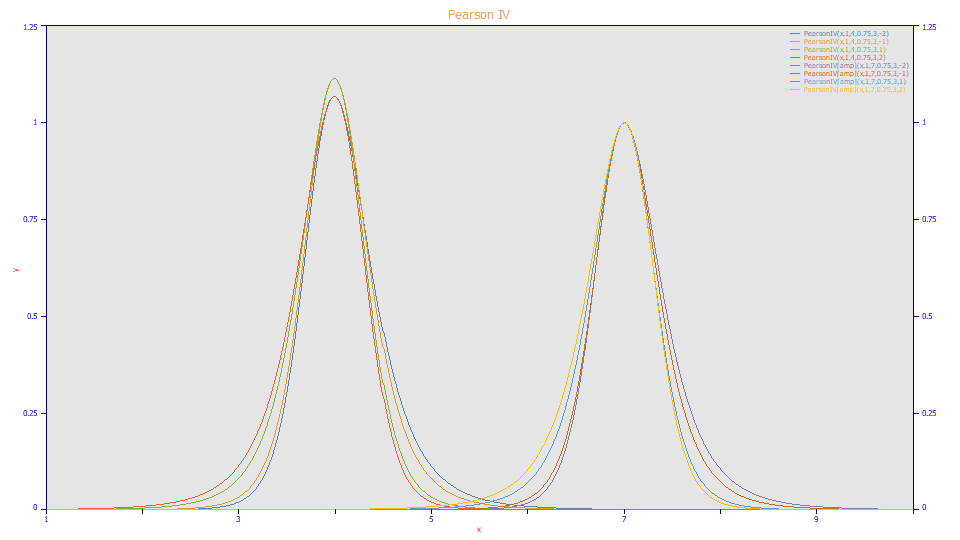
a0 = Area
a1 = Center
a2 = Width (>0)
a3 = Shape1 (>0)
a4 = Shape2
Built in model: PearsonIV
User-defined peaks and view functions: PearsonIV(x,a0,a1,a2,a3,a4)
Pearson IV Amplitude
a0 = Amplitude
a1 = Center
a2 = Width (>0)
a3 = Shape1 (>0)
a4 = Shape2
Built in model: PearsonIV[amp]
User-defined peaks and view functions: PearsonIV[amp](x,a0,a1,a2,a3,a4)
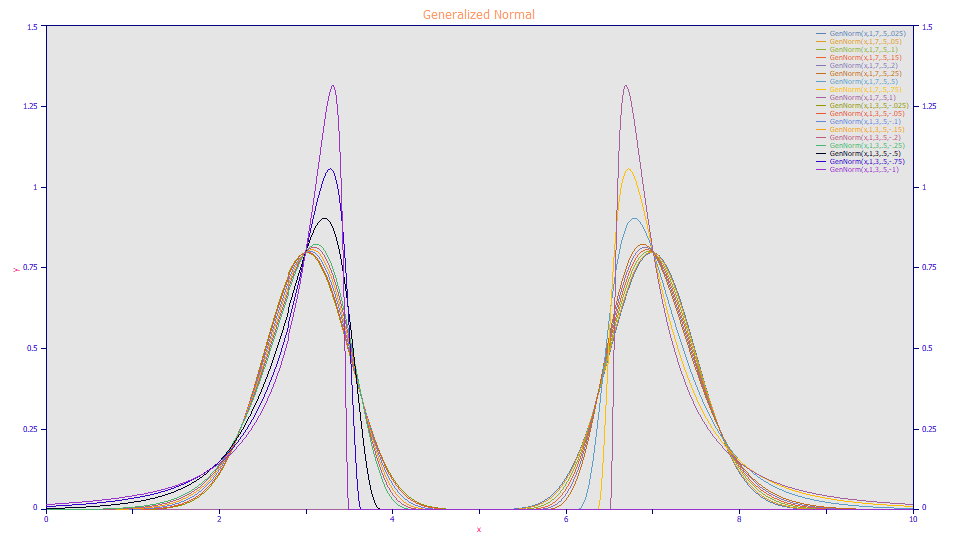
Generalized Normal
a0 = Area
a1 = Center (median)
a2 = Width (>0)
a3 = Asymmetry
Built in model: GenNorm
User-defined peaks and view functions: GenNorm(x,a0,a1,a2,a3)
Generalized Normal Amplitude
a0 = Amplitude
a1 = Center
a2 = Width (>0)
a3 = Asymmetry
Built in model: GenNorm[amp]
User-defined peaks and view functions: GenNorm[amp](x,a0,a1,a2,a3)
Generalized Normal Alternate Parametrizations
The Asymmetric Generalized Normal is available in a number of different parametrizations.
a1=mean (Default ZDD)
a0 = Area
a1 = Center (mean)
a2 = Width (>0)
a3 = Asymmetry
Built in model: GenNorm[m]
User-defined peaks and view functions: GenNorm[m](x,a0,a1,a2,a3)
a1=mode
a0 = Area
a1 = Center (mode)
a2 = Width (>0)
a3 = Asymmetry
Built in model: GenNorm[c]
User-defined peaks and view functions: GenNorm[c](x,a0,a1,a2,a3)
a2=SD
a0 = Area
a1 = Center (mean)
a2 = Width (SD)
a3 = Asymmetry
Built in model: GenNorm[d]
User-defined peaks and view functions: GenNorm[d](x,a0,a1,a2,a3)
a3=asym50
a0 = Area
a1 = Center (mean)
a2 = Width (>0)
a3 = Half-Height Asymmetry Asym50
Built in model: GenNorm[a]
User-defined peaks and view functions: GenNorm[a](x,a0,a1,a2,a3)
a1=mode, a2=FWHM
a0 = Area
a1 = Center (mode)
a2 = Width (FWHM)
a3 = Asymmetry
Built in model: GenNorm[cw]
User-defined peaks and view functions: GenNorm[cw](x,a0,a1,a2,a3)
a1=mean, a2=SD
a0 = Area
a1 = Center (mean)
a2 = Width (SD)
a3 = Asymmetry
Built in model: GenNorm[md]
User-defined peaks and view functions: GenNorm[md](x,a0,a1,a2,a3)
a1=mode, a2=SD
a0 = Area
a1 = Center (mode)
a2 = Width (SD)
a3 = Asymmetry
Built in model: GenNorm[cd]
User-defined peaks and view functions: GenNorm[cd](x,a0,a1,a2,a3)
a1=mean, a2=variance
a0 = Area
a1 = Center (mean)
a2 = Width (variance)
a3 = Asymmetry
Built in model: GenNorm[mv]
User-defined peaks and view functions: GenNorm[mv](x,a0,a1,a2,a3)
a1=mean, a2=variance, a3=skew
a0 = Area
a1 = Center (mean)
a2 = Width (variance)
a3 = Asymmetry (skew)
Built in model: GenNorm[mvs]
User-defined peaks and view functions: GenNorm[mvs](x,a0,a1,a2,a3)
a1=mode, a2=FWHM, a3=Asym50
a0 = Area
a1 = Center (mode)
a2 = Half-Height Width (FWHM)
a3 = Half-Height Asymmetry (Asym50)
Built in model: GenNorm[cwa]
User-defined peaks and view functions: GenNorm[cwa](x,a0,a1,a2,a3)
a1=mode, a3=Asym50
a0 = Area
a1 = Center (mode)
a2 = Width
a3 = Half-Height Asymmetry (Asym50)
Built in model: GenNorm[ca]
User-defined peaks and view functions: GenNorm[ca](x,a0,a1,a2,a3)
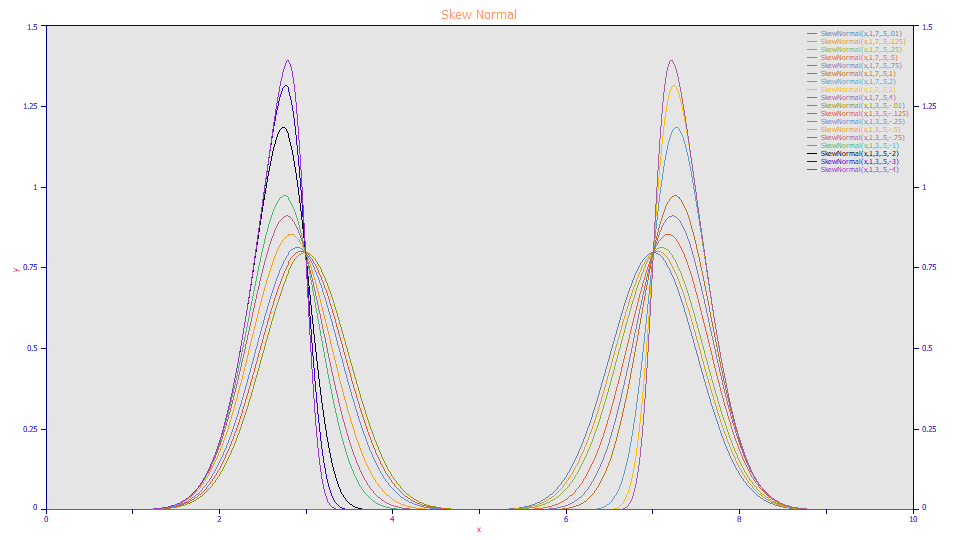
Skew Normal
a0 = Area
a1 = Center
a2 = Width
a3 = Asymmetry
Built in model: SkewNormal
User-defined peaks and view functions: SkewNormal(x,a0,a1,a2,a3)
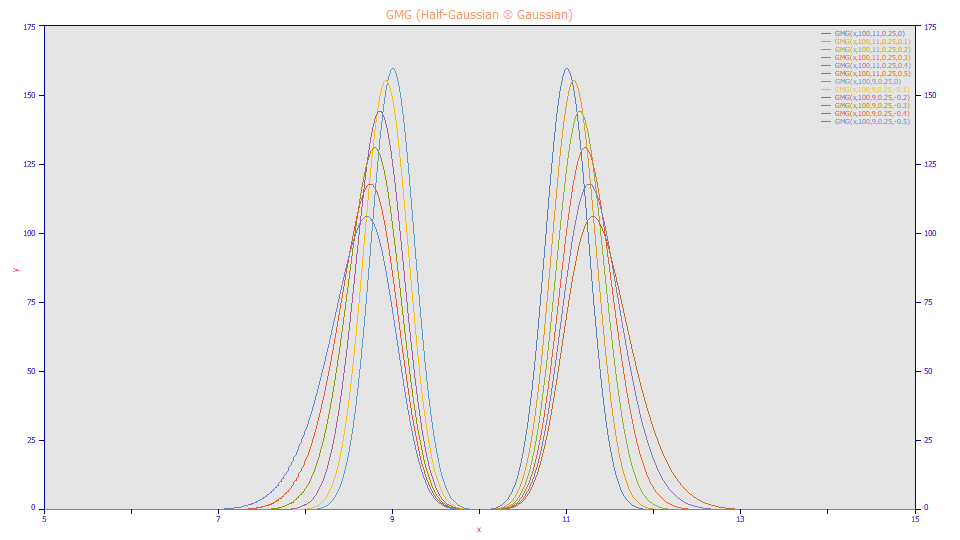
GMG (Half-Gaussian Ä Gaussian)
a0 = Area
a1 = Center
a2 = Full-Gaussian Width
a3 = Half-Gaussian Width
Built in model: GMG
User-defined peaks and view functions: GMG(x,a0,a1,a2,a3)
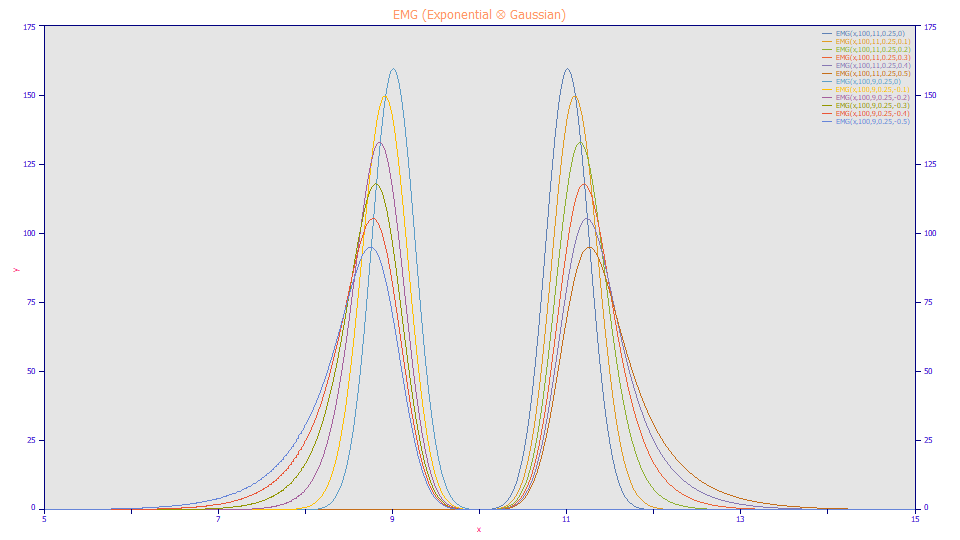
EMG (Exponential Ä Gaussian)
a0 = Area
a1 = Center
a2 = Gaussian Width
a3 = Exponential Decay Width (time constant)
Built in model: EMG
User-defined peaks and view functions: EMG(x,a0,a1,a2,a3)
EMG Alternate Parametrizations
a2=SD
a0 = Area
a1 = Center
a2 = SD of Convolution
a3 = Exponential Decay Width (time constant)
Built in model: EMG[d]
User-defined peaks and view functions: EMG[d](x,a0,a1,a2,a3)
a1=mean, a2=SD
a0 = Area
a1 = Center (mean)
a2 = Width (SD)
a3 = Exponential Decay Width (time constant)
Built in model: EMG[md]
User-defined peaks and view functions: EMG[md](x,a0,a1,a2,a3)
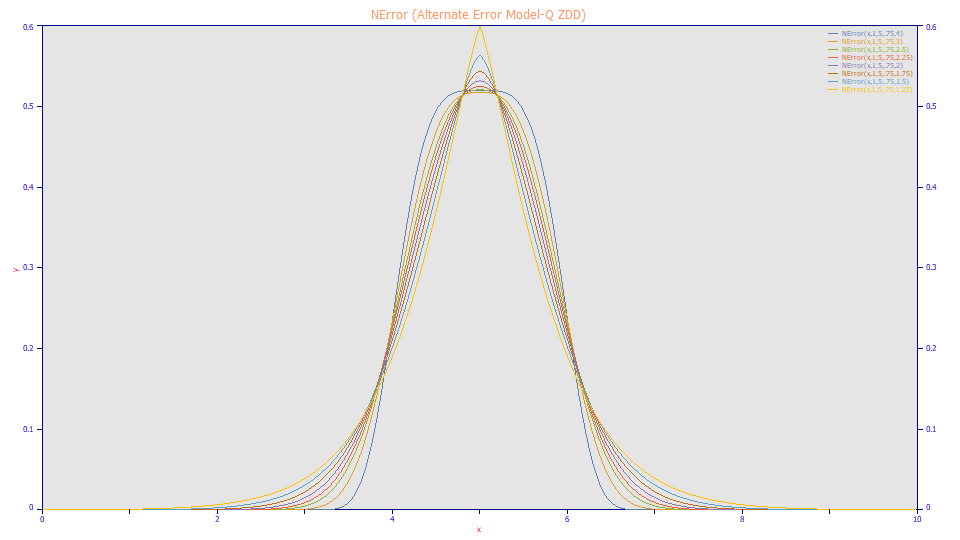
NError (Alternate Error Model-Q ZDD)
a0 = Area
a1 = Center
a2 = Width
a3= Error model power (.25 > a3 > 4 , Laplace=1, Gaussian=2)
Built in model: NError
User-defined peaks and view functions: NError(x,a0,a1,a2,a3)
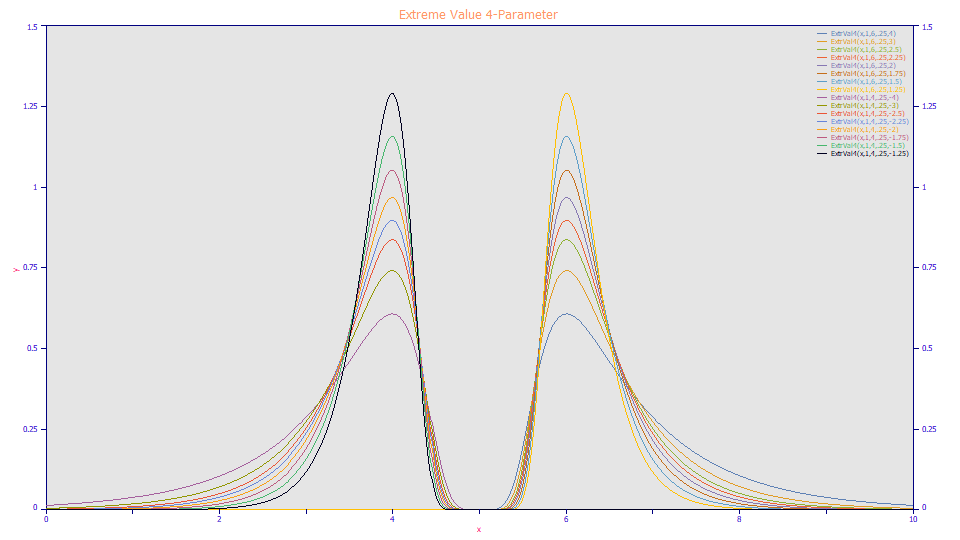
Extreme Value 4-Parameter
a0 = Area
a1 = Center
a2 = Width (>0)
a3 = Shape (>0)
Built in model: ExtrVal4
User-defined peaks and view functions: ExtrVal4(x,a0,a1,a2,a3)
Extreme Value 4-Parameter Amplitude
a0 = Amplitude
a1 = Center
a2 = Width (>0)
a3 = Shape (>0)
Built in model: ExtrVal4[amp]
User-defined peaks and view functions: ExtrVal4[amp](x,a0,a1,a2,a3)
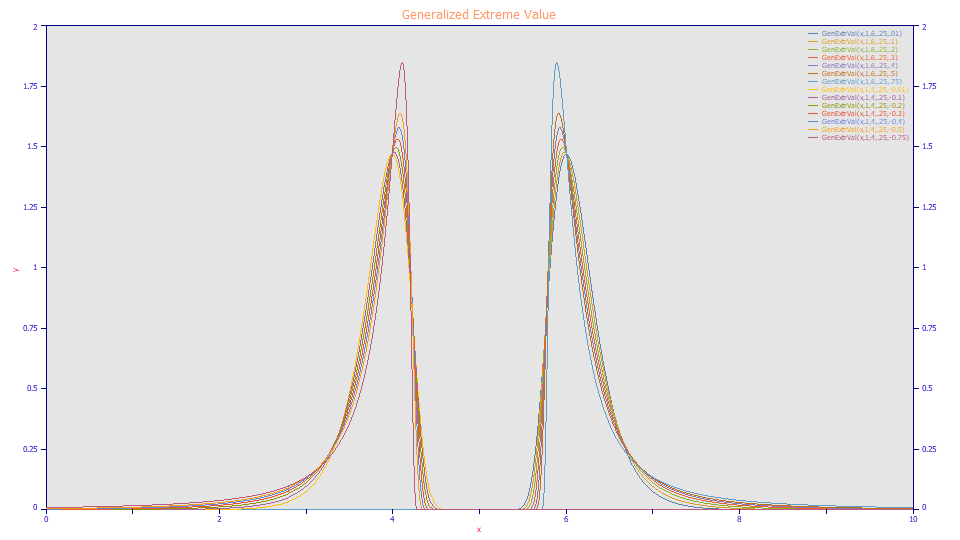
Generalized Extreme Value
a0 = Area
a1 = Center
a2 = Width
a3 = Shape
Built in model: GenExtrVal
User-defined peaks and view functions: GenExtrVal(x,a0,a1,a2,a3)
Generalized Extreme Value Amplitude
a0 = Amplitude
a1 = Center
a2 = Width
a3 = Shape
Built in model: GenExtrVal[amp]
User-defined peaks and view functions: GenExtrVal[amp](x,a0,a1,a2,a3)
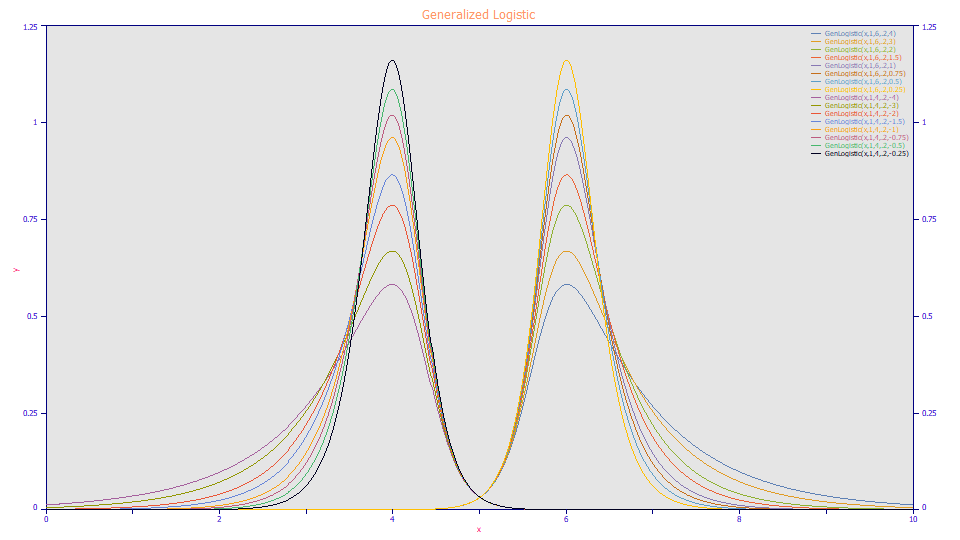
Generalized Logistic
a0 = Area
a1 = Center
a2 = Width
a3 = Shape
Built in model: GenLogistic
User-defined peaks and view functions:GenLogistic(x,a0,a1,a2,a3)
Generalized Logistic Amplitude
a0 = Amplitude
a1 = Center
a2 = Width
a3 = Shape
Built in model: GenLogistic[amp]
User-defined peaks and view functions: GenLogistic[amp](x,a0,a1,a2,a3)
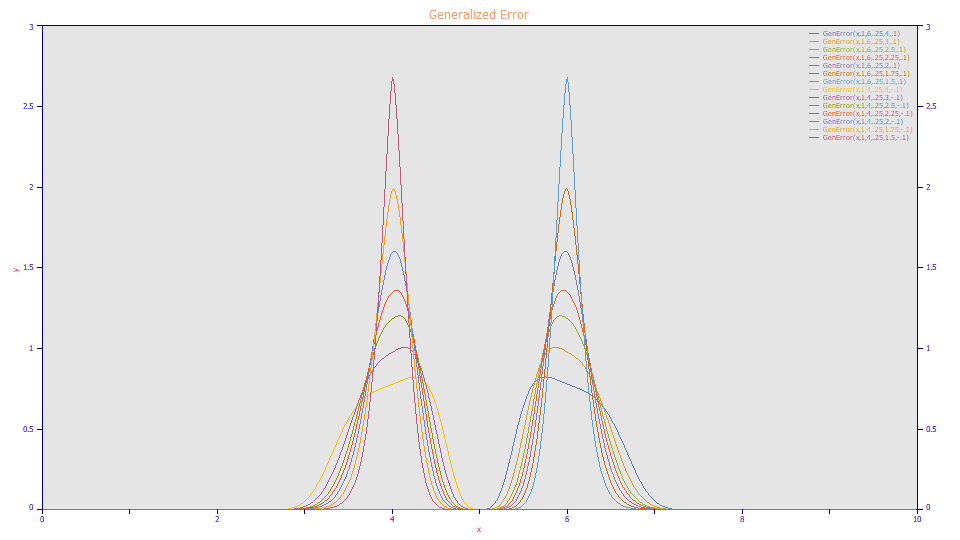
Generalized Error
a0 = Area
a1 = Center
a2 = Width
a3 = Power of Tail Decay
a4 = Asymmetry
Built in model: GenError
User-defined peaks and view functions: GenError(x,a0,a1,a2,a3,a4)
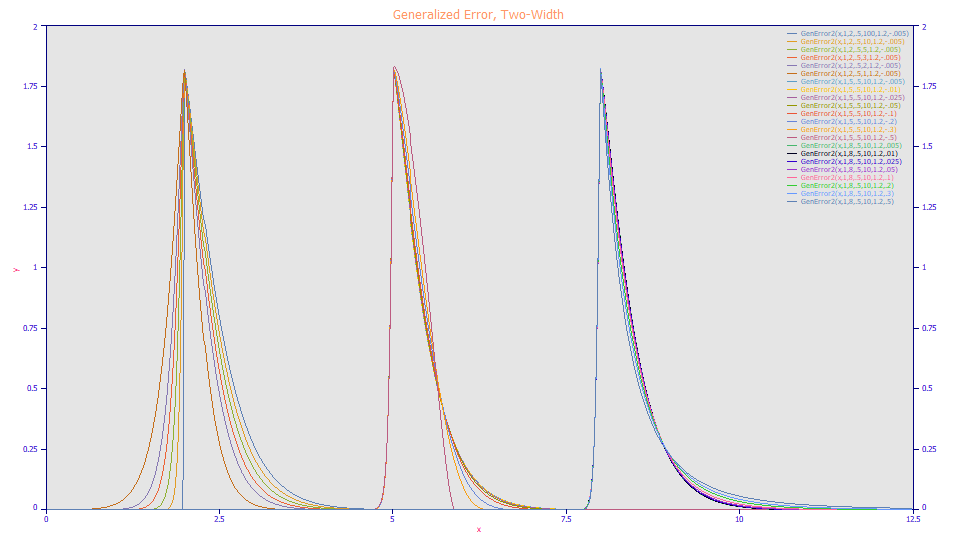
Generalized Error, Two-Width
a0 = Area
a1 = Center
a2 = Width, right
a3 = Fraction of a2 for Width, left
a4 = Error model power (.25 > a4
> 4 , Laplace=1, Gaussian=2)
a5 = Asymmetry ( fronted -1 > a5 > 1 tailed)
Built in model: GenError2
User-defined peaks and view functions: GenError2(x,a0,a1,a2,a3,a4)
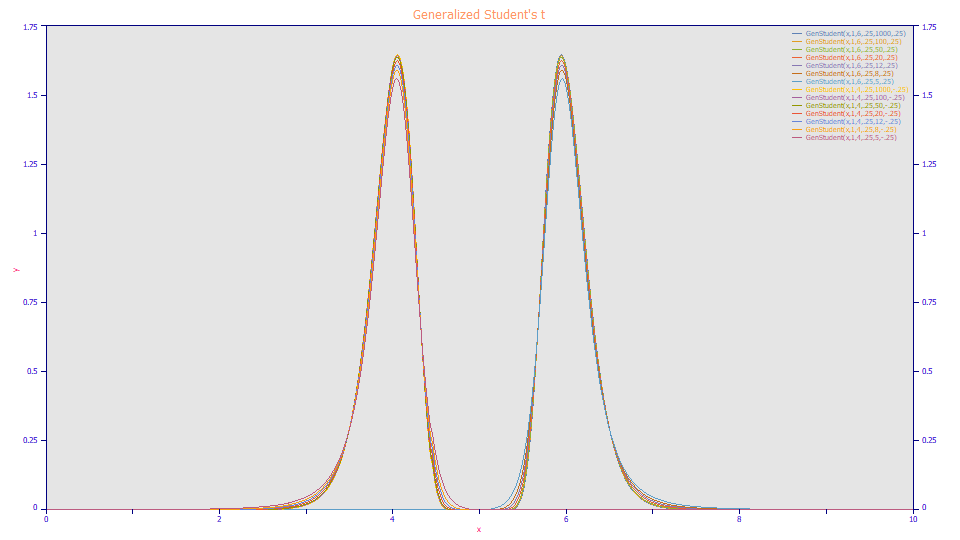
Generalized Student's t
a0 = Area
a1 = Center
a2 = Width
a3 = Tailing (Student's t nu or DOF)
a4 = Asymmetry
Built in model: GenStudent
User-defined peaks and view functions: GenStudent(x,a0,a1,a2,a3,a4)
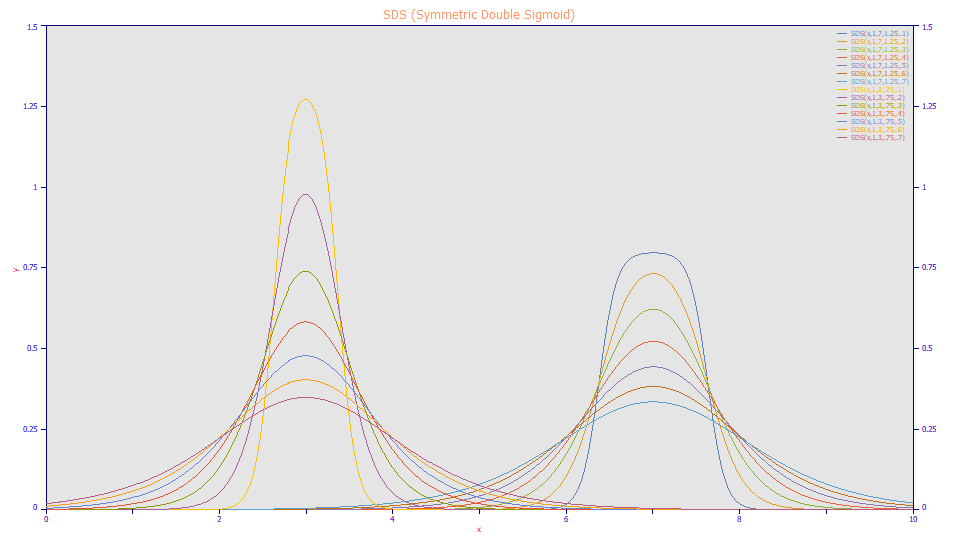
SDS (Symmetric Double Sigmoid)
a0 = Area
a1 = Center
a2 = Width
a3 = Sigmoid Width
Built in model: SDS
User-defined peaks and view functions: SDS(x,a0,a1,a2,a3)
SDS (Symmetric Double Sigmoid) Amplitude
a0 = Amplitude
a1 = Center
a2 = Width
a3 = Sigmoid Width
Built in model: SDS[amp]
User-defined peaks and view functions: SDS[amp](x,a0,a1,a2,a3)
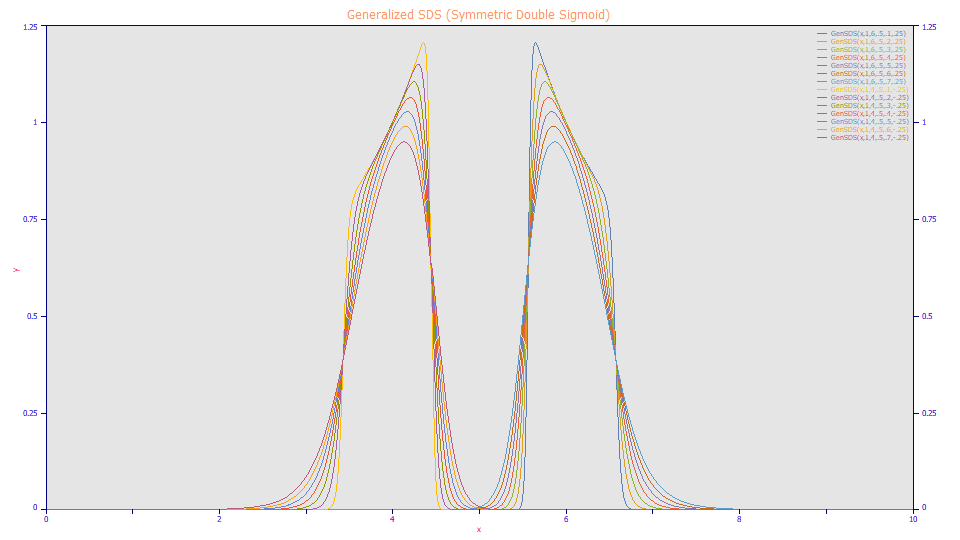
Generalized SDS (Symmetric Double Sigmoid)
a0 = Area
a1 = Center
a2 = Width
a3 = Adjusted Sigmoid Width (approximates Gaussian width in Generalized Models)
a4 = Asymmetry
Built in model: GenSDS
User-defined peaks and view functions: GenSDS(x,a0,a1,a2,a3,a4)
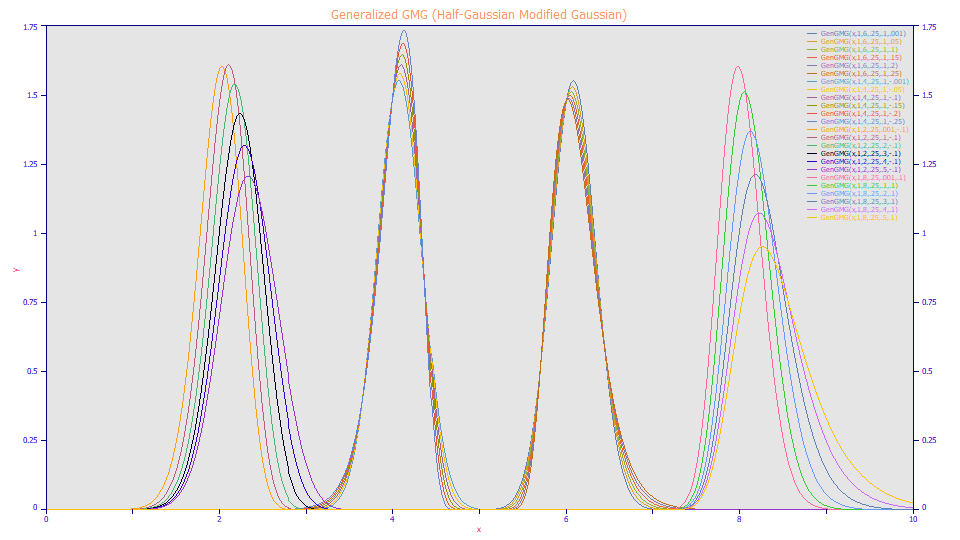
Generalized GMG (Half-Gaussian Modified Gaussian)
a0 = Area
a1 = Center
a2 = Width (>0)
a3= Half-Gaussian convolution width (>0)
a4 = Asymmetry ( fronted -1 > a4 > 1 tailed)
Built in model: GenGMG
User-defined peaks and view functions: GenGMG(x,a0,a1,a2,a3,a4)


 |