PeakLab
v2 Documentation Contents
R2N
Software Home
R2N
Software Support
View Mass Spec Data [time,m/z,intensity]...
The MassSpec menu contains this View Mass Spec Data [time,m/z,intensity]... option. This
is used for displaying a 3D visualization of your imported MS1 data matrices. You must first import MS
data using the MassSpec | Import MZML data... or the MassSpec | Import Agilent data.ms Data...
option.
Spectral Plot
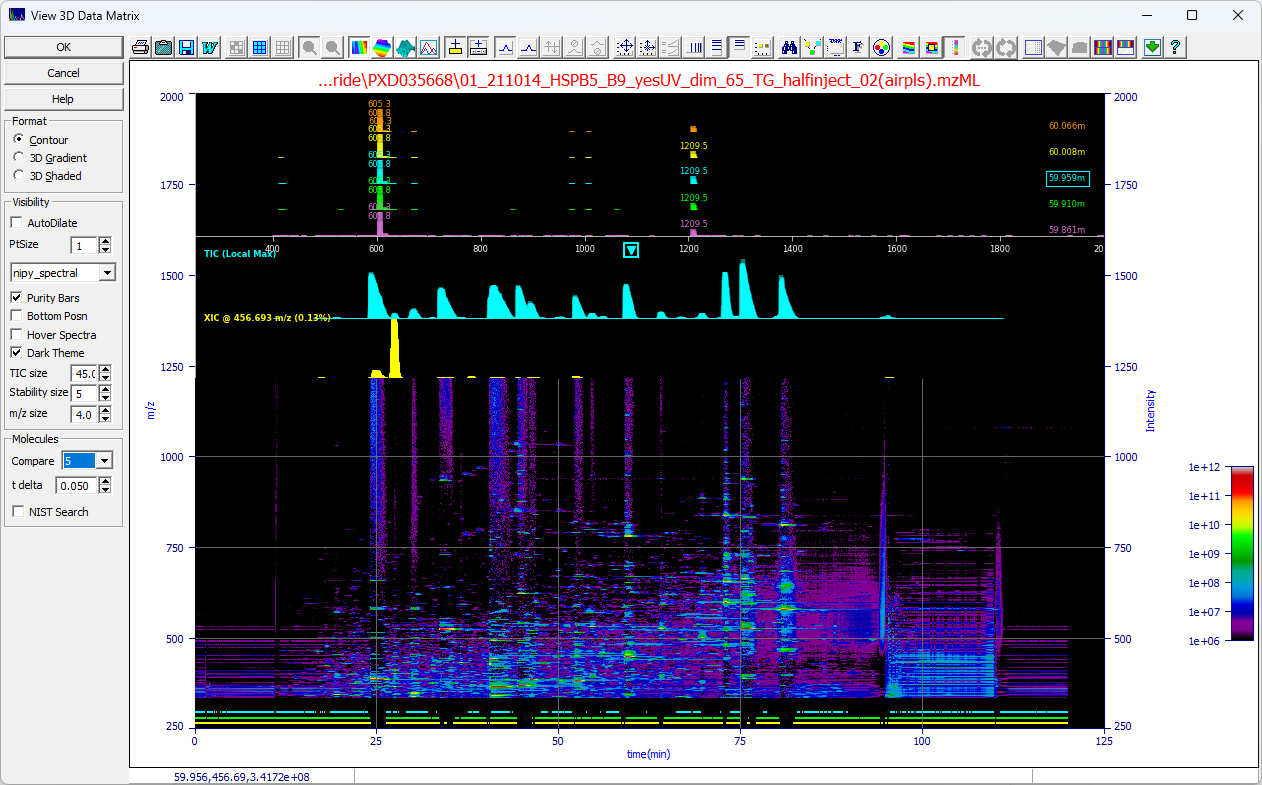
The Mass Spec data matrix visualization option has three main features, the 3D contour plot, the purity
bars, and a spectral pane or hover popup.
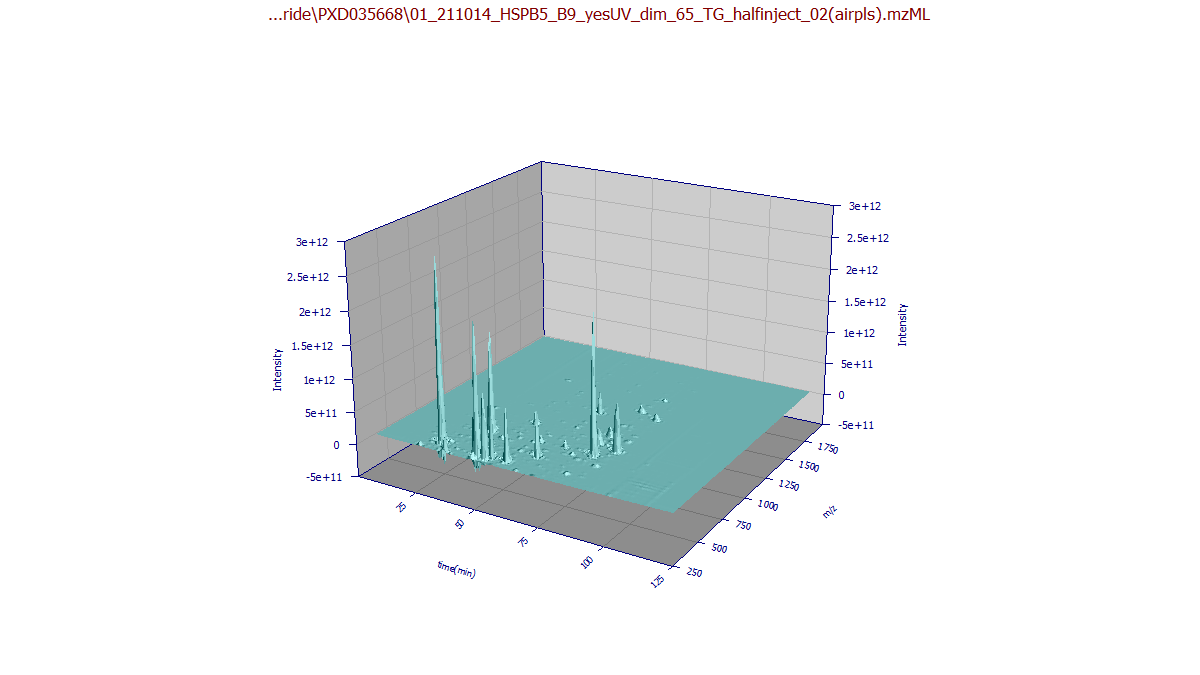
Visualization
While 3D surfaces provide a snapshot of signal distribution, they are often of limited analytical
utility compared to the Contour view. You can specify a 3D Gradient or 3D Shaded plot to
visualize mass distribution; for example, observing higher m/z values on later eluting compounds.
Dilation
Use AutoDilate to automatically adjust the data point size for optimal visibility based on your
current zoom level. If disabled, you can manually set the PtSize (pixel count). The default is
1 pixel, maximum resolution. Bear in mind that a 4K monitor has 8.3M pixels, an HD monitor 2.1M. Many
MS1 data matrices may be larger. The dilation emphasizes the largest signal in the pixel block.
Color Map
 The Select Color Gradient for Surface or Contour in the graph tool bar sets the 3D surface or 2D
contour color gradient. You can also use the dropdown in the Visibility section of the dialog to
directly explore the different color maps.
The Select Color Gradient for Surface or Contour in the graph tool bar sets the 3D surface or 2D
contour color gradient. You can also use the dropdown in the Visibility section of the dialog to
directly explore the different color maps.
Spectral Stability Ribbon (Purity Bars)
The Purity Ribbon provides a high-speed assessment of spectral homogeneity using a vectorized Pearson
correlation algorithm. The software compares the mass spectrum at every point along a peak to the spectrum
at its apex.
Cyan (Top): The core of the peak where the molecule is virtually 100% pure (Correlation
> 0.99)
Green (Middle): The high-confidence analytical region (Correlation > 0.95)
Yellow (Bottom): The extended boundary of the peak before spectral noise or interference
dominates (Correlation > 0.90)
If the spectra match at a 0.99 correlation, for example, the cyan bar is drawn; if they drop to
0.95, the green bar ends, and so on. If the Purity Bars are significantly offset from the peak's visual
center, it indicates a co-elution or a matrix suppression event on one side of the peak.
A solid, continuous ribbon indicates high chemical purity. A break in the ribbon, particularly the
yellow 90% bar, is a strong indicator of co-elution. If the Purity Bars are significantly offset from
the peak's visual center, it may indicate matrix suppression or an overlapping impurity on one side of
the feature.
Size of Stability Bars
The Stability Size allows the thickness of the purity bars to be adjusted.
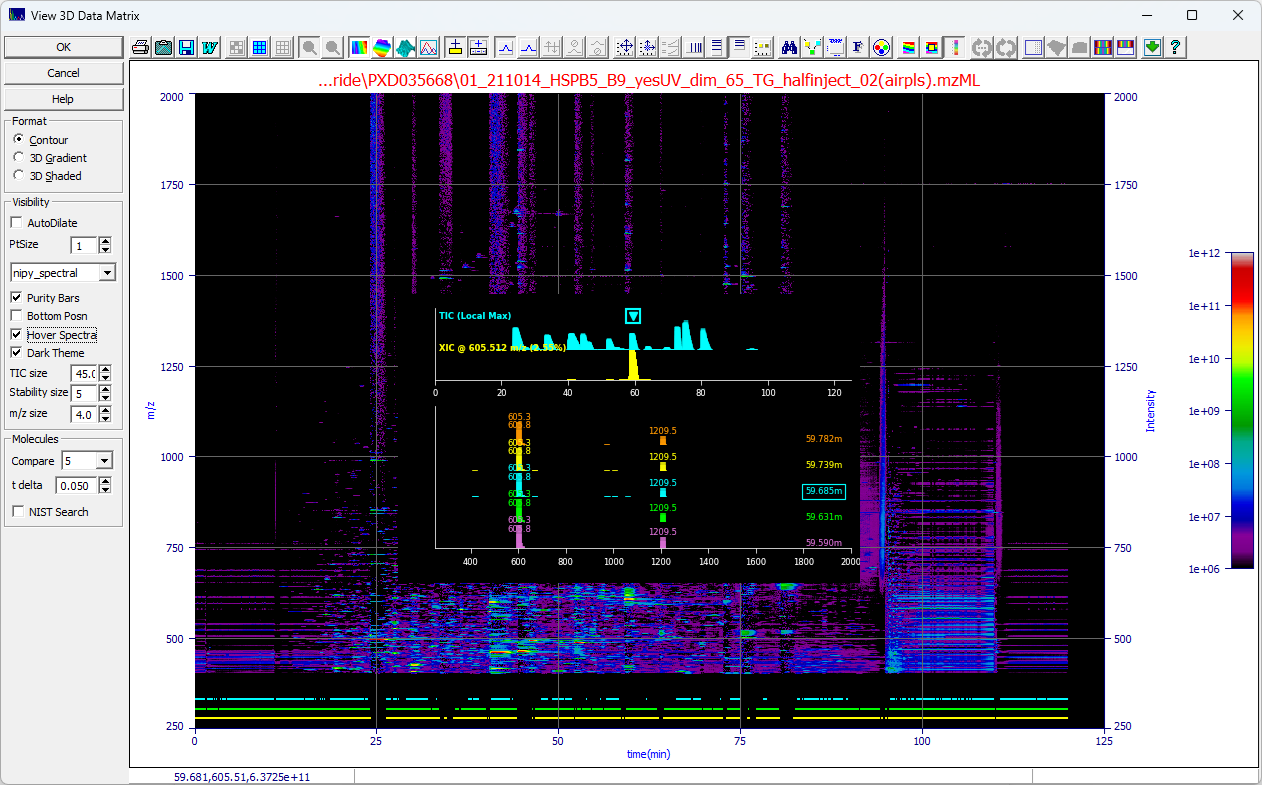
Spectral Pane or Hover Popup
If the Hover Spectra is checked, you will see the following when your mouse is over the data matrix
in the plot. The popup changes as you move the mouse.
Position for Fixed Display
If the Hover Spectra option is unchecked, the 2D spectral pane will be fixed in the upper portion
of the plot, or the lower half if Bottom Posn is checked.
Theme
You can choose a Dark Theme for this spectral pane or popup.
Size of Fixed Display
The TIC size is the amount of the plot area in % dedicated to the spectral pane when Hover Spectra
is unchecked..
Size of m/z Vertical Bars
The m/z size controls the size of the m/z bars in the spectral pane or popup.
Content of Spectral Pane or Popup
When the spectral pane is fixed the 3D contour of the data matrix will align by time value with the
TIC, shown above in cyan, and the XIC at the current m/z (y) mouse position, shown above in yellow. The
uppermost plot will consist of the MS1 signature at the time and m/z of the mouse position.
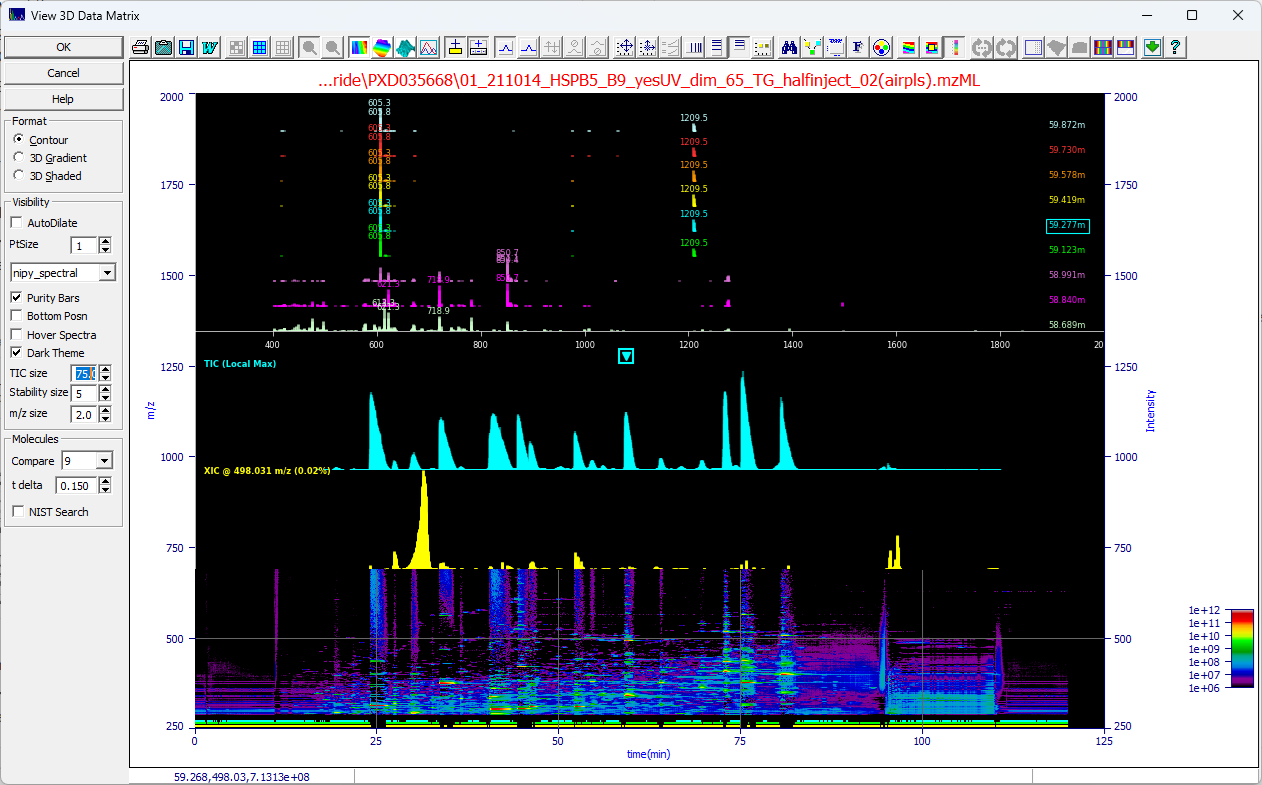
You can Compare from 1 to 9 spectra at the t delta you specify. The central location will
be shown as a boxed arrow in the TIC and he boxed label in the upper m/z time windows plot. If you have
zoomed in the plot you will see arrows across a given peak:
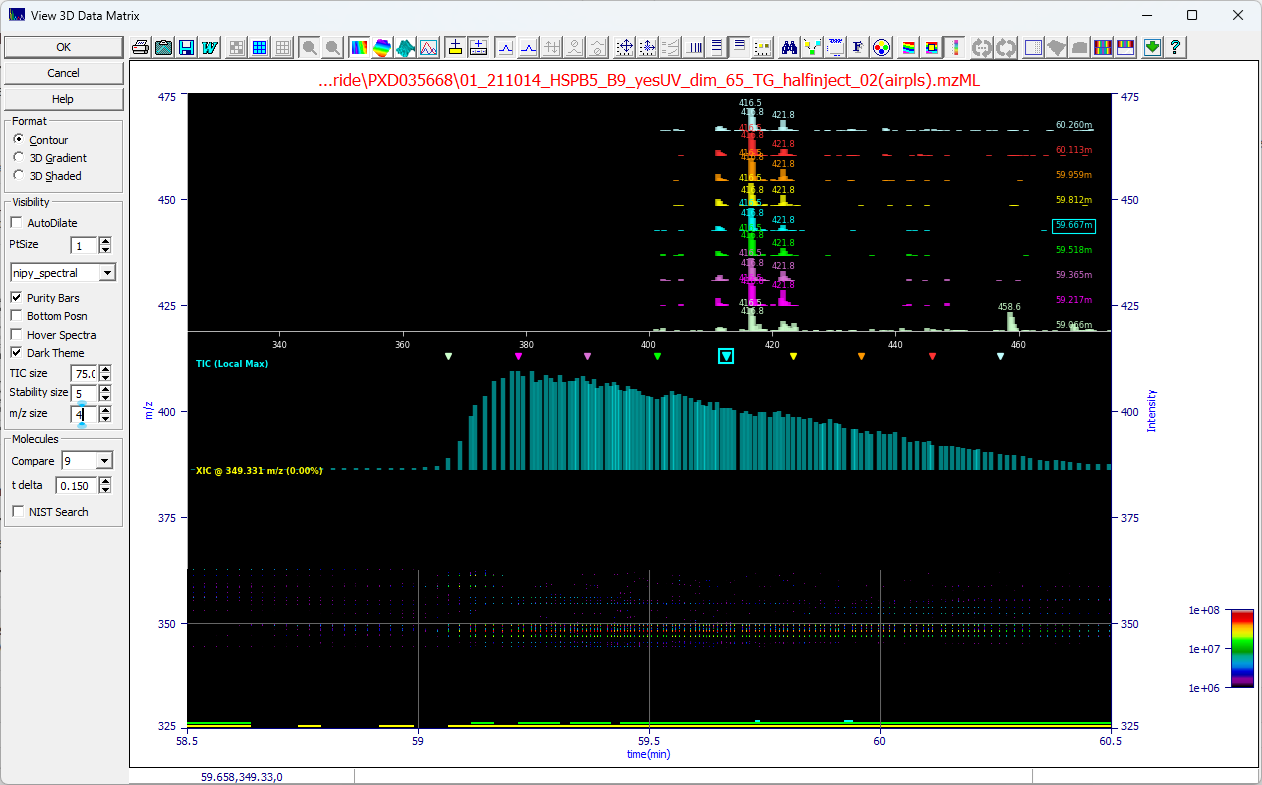
If we set Compare to 9 for nine m/z spectra in time and set the t delta to .15 min on
this data set, we see the first of the spectra at the rise of the peak with additional m/z peaks and we
start to see another entity appearing well into the tail with additional peaks. We see that the m/z map
is not constant across the peaks with many components in the overall peak envelope.
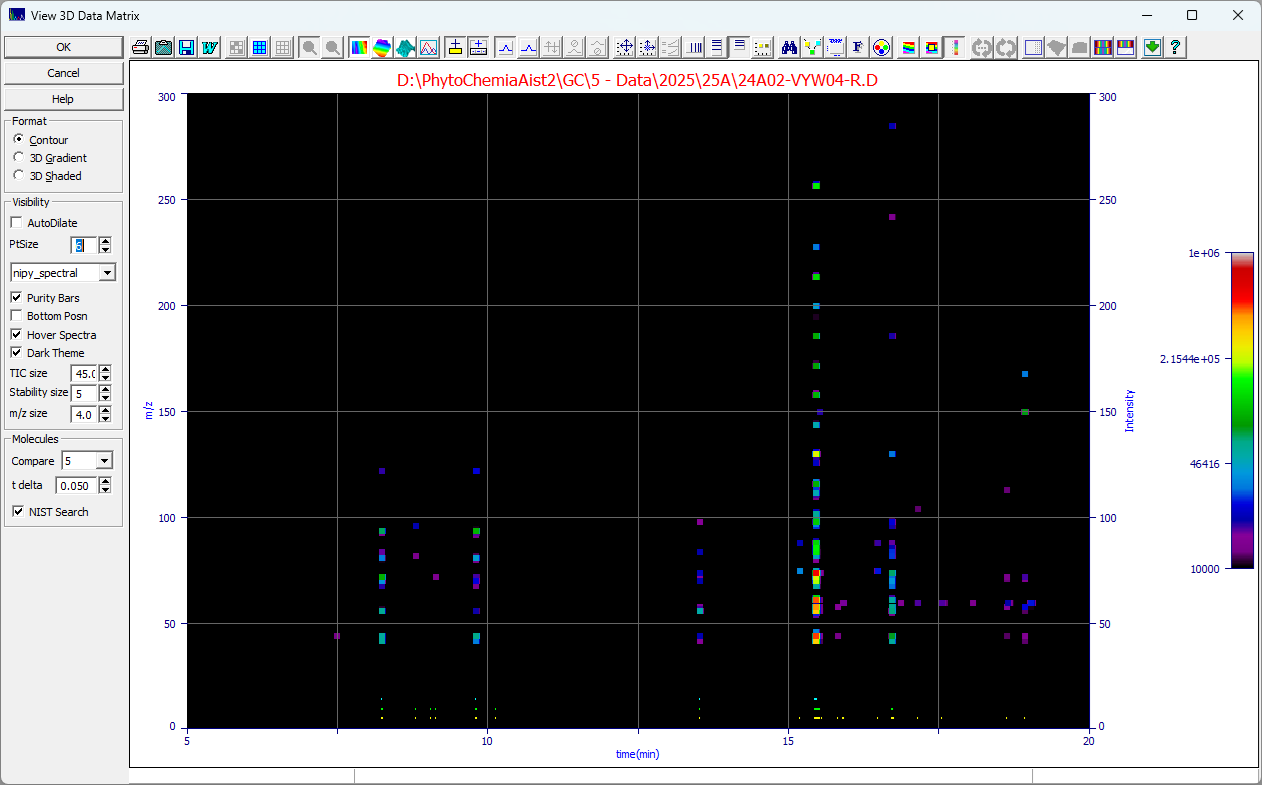
NIST Search
Because PeakLab only imports MS1 data, this NIST Search option is only useful for GC-MS where the
MS1 streams contain the fragmentation patterns. Further, since PeakLab does not presently have an option
to deconvolve co-eluting m/z spikes, this will only be helpful when a single molecule exists at the point
in time you've selected by left clicking the mouse at the time desired. In the case of overlapping peaks,
this will only work when two peaks have some degree of separation, where some measure of single component
is on the leading and trailing edge of the feature. For co-elutions where the molecules require true m/z
fragment deconvolution, this option will not be helpful for identification.
The following GC MS data set was imported and background filtered to remove the column bleed and the
NIST Search was checked and a click was made at 8.242 min:
The program will find the NIST app and produce an identification:
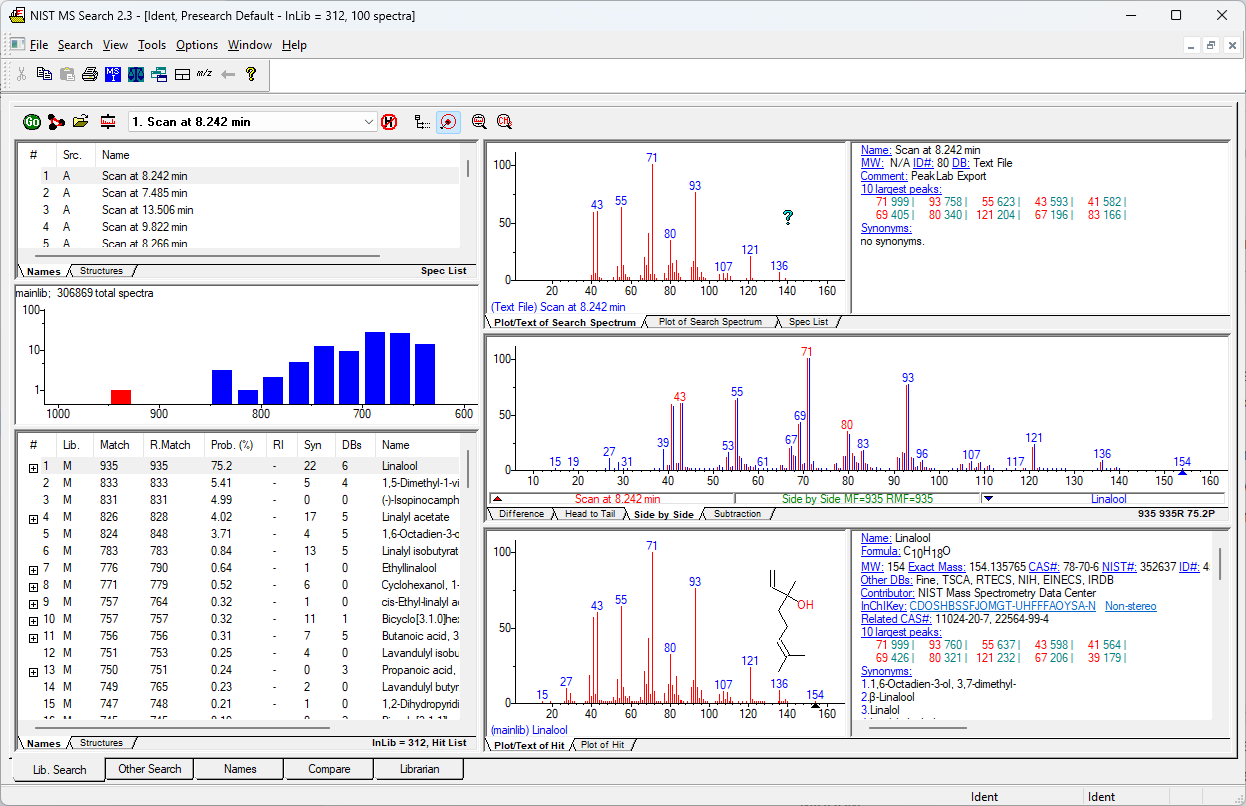
You must independently install the NIST app and purchase the database(s) you need for identification.
PeakLab furnishes this option as a convenience when viewing GC-MS MS1 data.