PeakLab v1 Documentation Contents AIST Software Home AIST Software Support
Fitting Coeluting Peaks (Tutorial)
For this advanced tutorial, we will process and fit data where two peaks coelute and appear to be a single peak. This technique, is useful for HPLC and UHPLC separations where full 3D diode-array detector (DAD) data is available. In such DAD data, there is both UV-VIS spectral and time independent variables and a dependent spectral variable consisting of a matrix where there is a specific spectral value for each wavelength and elution time.
Step 1: Determine the Wavelength where the Maximum Signal Exists for Each Component
This technique requires the analysis of experimental data where the apex of the individual component spectra are determined or where the zero values of a first derivative spectra are determined. Ideally, the wavelengths will be determined using the DAD of the machine where the coeluting peak is generated. This can be done by using the spectroscopy from the DAD data for specific standards, provided the two components are known and reagent-grade standards are available. If not, you may need to run a separation with a longer column than the one where the coelution is observed. Even if that separation has a high measure of overlap it should still be possible to extract the pure spectra from the non-overlapping times observed in fitting the two overlapping components.
For this tutorial, we have created a 100% coelution data set by combining two individual component spectra that differ by only about 4nm in the location of the apexes.

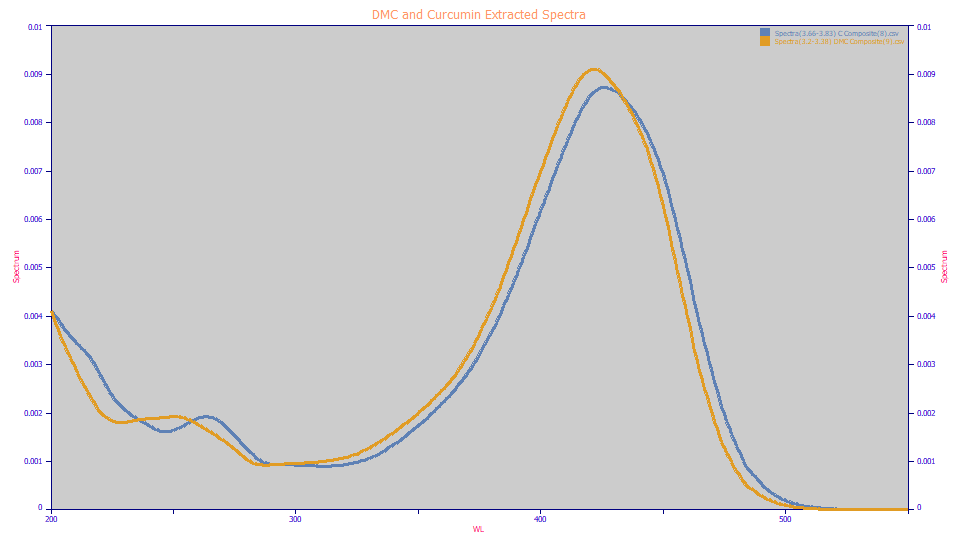
For the wavelengths that will be used in this tutorial, we created a 3D DAD spectra by combining the two matrices of demethoxycurcumin and curcumin. These are the spectra extracted using the File menu's Import Data Sets(s) | DAD 3D Chromatography | Import Spectroscopy from DAD 3D Data Matrix... option. The amber curve is the DMC UV-VIS, its VIS apex at 421.96nm and the blue curve is the curcumin, its VIS apex at 426.04. For this method to unscramble a coelution, the two components must have different peaks locations in the UV spectra, although the two spectra can be close to identical. Here we have peaks in both the UV and blue bands where the first partial derivative with respect to wavelength will be zero.
The principle is that a first derivative peak at the DMC apex wavelength will contain only the curcumin since the curcumin still has a good upward slope at 421.96 nm where the DMC is zero at its apex. Similarly, the a first derivative peak at the curcumin apex wavelength will contain only the DMC since it has a good downward slope at 426.04 nm where the curcumin is zero at its apex.
As an alternative we could have used the first derivative spectra generated by the File menu's Import Data Sets(s) | DAD 3D Chromatography | Create First Derivative DAD Matrix... option and use the Update Extrema option with the little zero zone zoomed in to find these wavelengths. This may be preferable, though hardly as intuitive, for finding these two wavelengths since this procedure is used to create the 3D first derivative data matrix that will be used for the chromatographic modeling.
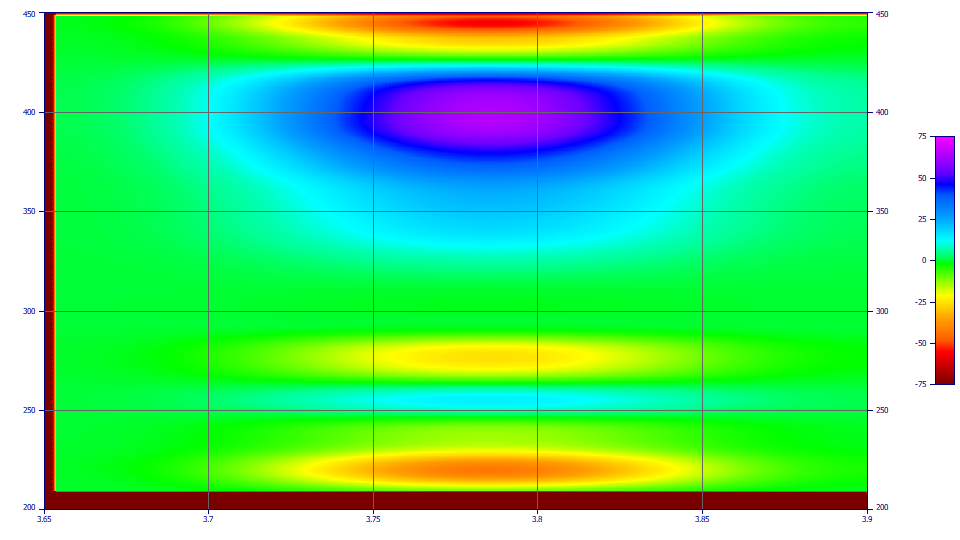
This example is for the pure curcumin D1 spectra. If you zoom just the upper green region between the magenta/blue (D1 + sign) and the yellow/red (D1 - sign), and click Update in the File menu's Import Data Sets(s) | DAD 3D Chromatography | View/Reduce DAD Data Matrix... option, the Y in the Min(Abs(Z)) in the Extrema list will be somewhere in the vicinity of 426.22, close to the 426.04 as taken from the extracted spectra. If we do the same for the DMC, we see 421.82 as the wavelength for the zero D1, very close to the 421.96 from the extracted spectra. For the purpose of this tutorial, we will use the D1 zero values since these will be based on the actual algorithm that generates the D1 chromatography. We thus use 421.82 nm to zero out the DMC, and 426.22 nm to zero out the curcumin.
Step 2: Create the D1 Data Matrix
Select the File menu's Import Data Sets(s) | DAD 3D Chromatography | Create First Derivative DAD Matrix... option and choose the file BDMC_DMC_C_0_pt3_pt7(r).csv from the program's installed default data directory (\PeakLab\Data). This is a 3D DAD matrix file containing a blend of 30% of a DMC spectra and 70% of a curcumin spectra. These were from two separations with equal concentrations of the two pure components, the times normalized so that the peak of each eluted at an exact 1.0 minute time, a complete coelution. To keep the file as small as possible, it was reduced so that only the 0.97 to 1.03 times are present, and only the 210-450 nm wavelengths,
Specify BDMC_DMC_C_0_pt3_pt7_(r)-d1.csv as the file name for the exported first derivative matrix. Answer Yes to view the file:
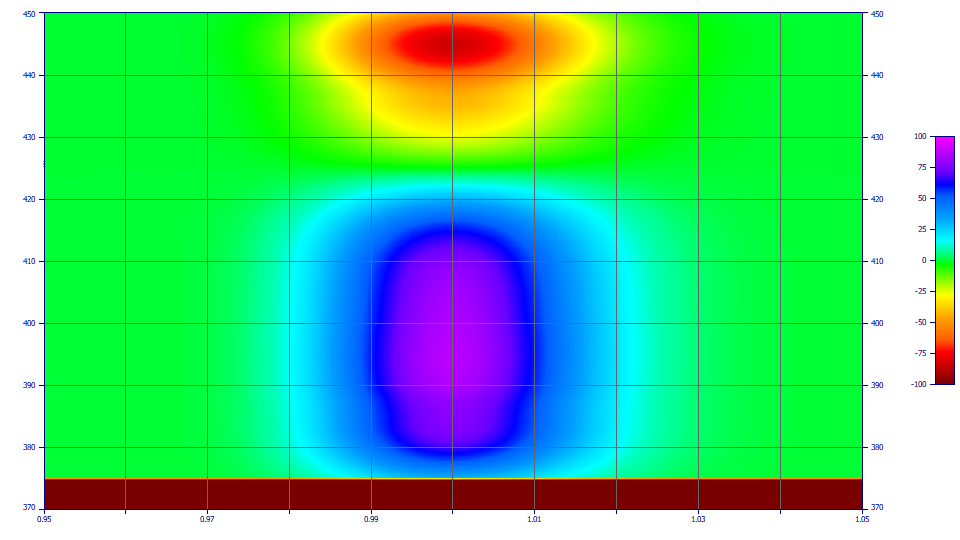
This is the D1 DAD spectral data for the blended DMC and curcumin in an exact coelution. Click OK to close. Note that the D1 zero wavelength of the blended spectra has no value in this method.
Step 3: Extract the D1 Chromatographic Peaks from the Coeluting Data
Select the File menu's Import Data Sets(s) | DAD 3D Chromatography | Import Chromatography from DAD 3D Data Matrix...:
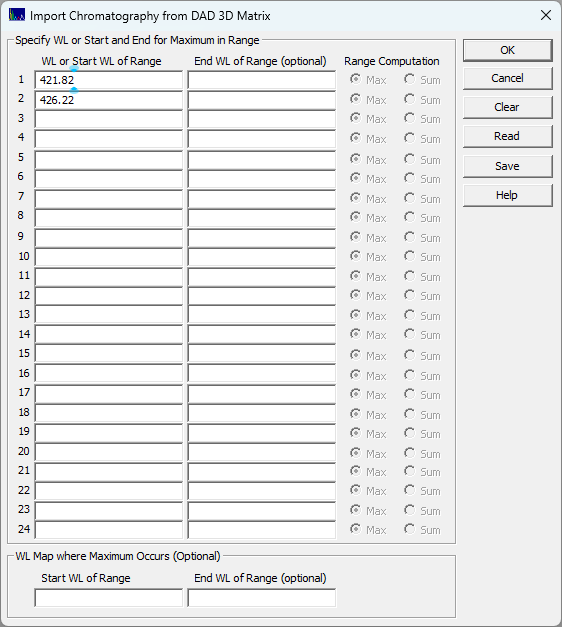
Enter 421.82 and 426.22 as above and click OK.
Choose the file BDMC_DMC_C_0_pt3_pt7_(r)-d1.csv we just created containing the D1 DAD matrix.
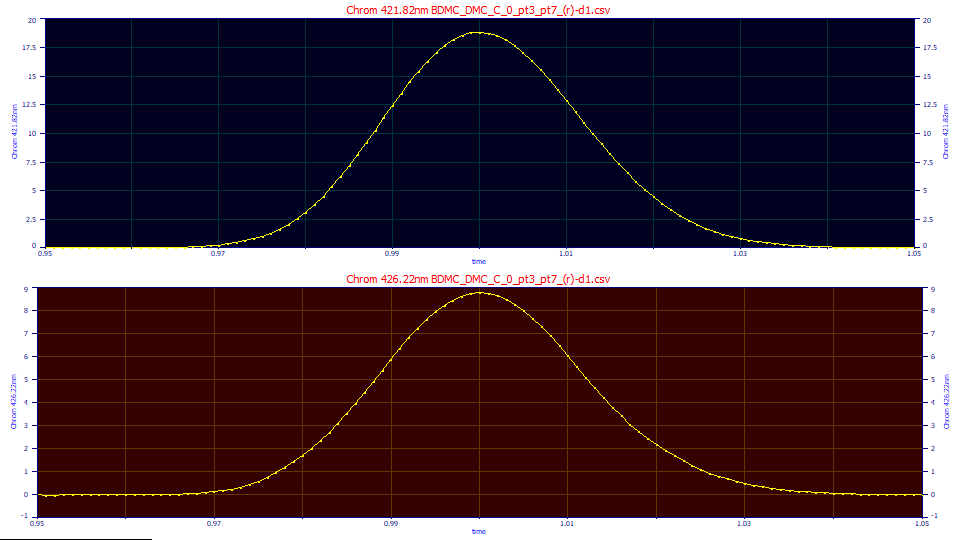
The main window will now contain two chromatographic data sets derived from D1 spectra. The first, taken at 421.89, at the DMC zero D1 wavelength, will contain the curcumin D1 signal. The second, taken at 426.13, at the curcumin zero D! wavelength, will contain the DMC signal.
Step 4: Determine the Areas of Each Component and Adjust for Spectral Absorbance
We will fit these peaks to a GenHVL model. Click Local Maxima Peaks. For Peak Type select the Chromatography family and the GenHVL model. Set the Sm n(1) smoothing level for peak detection to 10 and the Amp% amplitude threshold to 1.5%. The other settings should not matter. Click Peak Fit and select the simplest Fit with Full Data and click OK. Click Review Fit (the two fits will be close to immediate). Click Numeric. In the Numeic Summary window's Options menu, choose the Select Only Fitted Parameters option:
"Chrom 421.82nm BDMC_DMC_C_0_pt3_pt7_(r)-d1.csv"
"Pk=GenHVL 1 Peak "
"r2=0.999988 SE=0.0230659 F=2,015,448 ppm=11.91"
"time"
"Chrom 421.82nm"
Fitted Parameters
r2 Coef Det DF Adj r2 Fit Std Err F-value ppm uVar
0.99998809 0.99998747 0.02306591 2,015,448 11.9078804
AICc BIC MDL
-753.65308 -738.85597 -664.03273
Peak Type a0 a1 a2 a3 a4
1 GenHVL 0.53055478 1.00068353 0.01121696 -1.281e-05 0.07022889
"Chrom 426.22nm BDMC_DMC_C_0_pt3_pt7_(r)-d1.csv"
"Pk=GenHVL 1 Peak "
"r2=0.999858 SE=0.0370763 F=169,004 ppm=141.99"
"time"
"Chrom 426.22nm"
Fitted Parameters
r2 Coef Det DF Adj r2 Fit Std Err F-value ppm uVar
0.99985801 0.99985054 0.03707629 169,004 141.988024
AICc BIC MDL
-657.77949 -642.98238 -583.03118
Peak Type a0 a1 a2 a3 a4
1 GenHVL 0.25266079 0.99973763 0.01140616 -4.769e-05 0.08452707
The first data set, which zeroes out the DMC, has an area of 0.53055 for the curcumin. The second data set, which zeroes out the curcumin, has an area of 0.25266. Before we can test for the 70:30 curcumin:DMC ratio in the coeluted peak, we must account the differences in absorptions between the two components. The blended DAD data was based on the actual DAD spectra of equal concentration of the two different components without adjustments for the different absorptions. For an equal mass of each component, there is an area of 558.54 for the DMC when the chromatography of a fixed concentration of DMC is taken at its maximum absorption wavelength (at 422 nm in the instrument. For curcumin at an equal concentration and where the chromatography is taken at its maximum absorbance wavelength, the area is 485.72.
|
30% DMC |
Area |
Absorb |
AdjArea |
Ratio |
|
DMC |
0.25266 |
558.539 |
0.000452 |
0.292853 |
|
C |
0.53055 |
485.716 |
0.001092 |
0.707147 |
|
Total |
0.78321 |
|
0.001545 |
|
The results are favorable. Still, the strength of this method is also its weakness. It can separate two coeluting components very effectively, but it is very sensitive to the wavelengths chosen for this zeroing of the two different components. Two very similar coeluting components spectrally can be quantified quite well by this method, but the wavelengths that fully zero each of the components must be accurate and specific to the spectral measurements of the instrument's specific DAD.
There are instances in chromatography where the mass spec finds two coeluting components, but where PeakLab cannot detect a hidden peak except indirectly by the fact the fit of that single peak has a weaker goodness of fit, and possibly inconsistent parametric trends, when compared with other nearby peaks. If you can get the chromatography to produce just enough of a separation between the two components that only one component is seen in the initial rise of the two peak overlap and the other only in the final decay, the UV-VIS spectra can be reconstructed for those bands of elution times. The data may be noisy, but you may be able to extract enough of a UV-VIS spectrum from the initial rise and final decay of such a composite peak in order to get the apex wavelengths of the two components and apply this method. The WL Map where Maximum Occurs may be helpful as well if you can see a transition occur across the elution width of the peak.
 |