PeakLab v1 Documentation Contents AIST Software Home AIST Software Support
Generate Properties Estimates
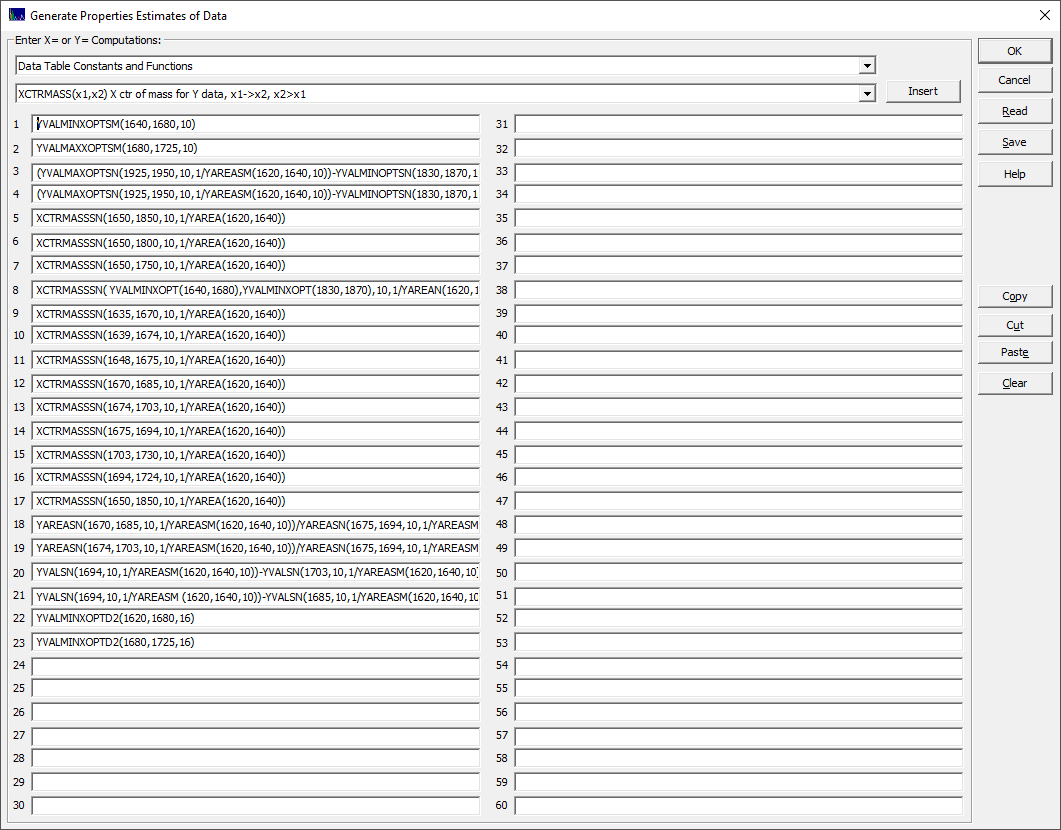
The right click menu Generate Properties Estimates... option opens a dialog for computing estimates of data properties and writing them to an CSV (comma separated value) ASCII file. This option is selected from the main data window graphs and operates on the data level currently selected.
This option is useful for generating predictors from spectral data. You may wish to model your chromatographic analytics to such spectral predictors.

You can enter up to 60 property formulas. Use the Data Table Constants and Functions parser help for the different options available.
In general, you will want to create layers consisting of smoothing, normalization transforms, and other modifications to the data that will apply to all of the computations. Each output can be appended to any previously written file, so properties from different data levels can be easily be placed in a single data file.
As a convenience, there are certain functions which will temporarily create smoothed or normalized data streams in order to compute a specific property. This is useful if you wish to mix normalized and unnormalized properties, smoothed and unsmoothed properties, and function and D2 (second derivative) smoothed properties, in a single step.
These are main items you will likely use:
YVAL(x) Y data at or nearest x value
YVALMIN(x1,x2) Y data minimum value x1->x2, x2>x1
YVALMAX(x1,x2) Y data maximum value x1->x2, x2>x1
YVALMINX(x1,x2) X data at Y data minimum x1->x2, x2>x1
YVALMINX(x1,x2) X data at Y data maximum x1->x2, x2>x1,
YVALMINOPT(x1,x2) Y data interpolated minimum x1->x2, x2>x1
YVALMAXOPT(x1,x2) Y data interpolated maximum x1->x2, x2>x1
YVALMINXOPT(x1,x2) X data value at Y data interpolated minimum x1->x2, x2>x1
YVALMAXXOPT(x1,x2) X data value at Y data interpolated maximum x1->x2, x2>x1
YAREA(x1,x2) Y value area x1->x2, x2>x1
YSUM(x1,x2) Y value sum x1->x2, x2>x1
YSUMGT0(x1,x2) Y value sum x1->x2, Y values >0, x2>x1
YSUMLT0(x1,x2) Y value sum x1->x2, Y values <0, x2>x1
XCTRMASS(x1,x2) X ctr of mass for Y data, x1->x2, x2>x1,
XCTRMASSYGTY0(x1,x2,y0) X ctr of mass for Y values >y0, x1->x2, x2>x1
XCTRMASSYLTY0(x1,x2,y0) X ctr of mass for Y values <y0, x1->x2, x2>x1
Normalization
By adding an N suffix to the function, you will have two additional functions available. The following is for the the YVALMINN function:
YVALMINN(x1,x2,yfac,zero) Y minimum value x1->x2, x2>x1, y normalize
YVALMINN(x1,x2,yfac) Y minimum value x1->x2, x2>x1, y normalize
There will either be one or two additional arguments. The yfac is a multiplicative factor of normalization. If you are normalizing for area, for example, you would specify 1/YAREA(x1,x2) for the yfac argument. Add a second additional argument, 1, for zeroing the normalization so that Ymin=0 between x1 and x2. The property is only computed after the normalization is made.
Smoothing
By adding an SM suffix to the function, you will generate the estimated property from a temporary smoothed copy of the data. The following is for the the YVALMAXXOPTSM function:
YVALMAXXOPTSM(x1,x2,npts) X value at smoothed Y data interpolated maximum x1->2, x2>x1
There will either be one additional argument, the npts of the Savitzky-Golay smoothing window. The property is only computed after the smoothing is made.
Smooth Second Derivative
By adding a D2 suffix to the function, you will generate the estimated property from a temporary second derivative smoothed copy of the data. The following is for the the XCTRMASSD2 function:
XCTRMASSD2(x1,x2,npts) X ctr of mass for smoothed D2, x1->x2, x2>x1
Identical to the SM function smoothing, the npts will be the size of the Savitzky-Golay smoothing window. The property is only computed after the smoothing is made. Note that in general, a D2 smoothing window will need to be larger than the size used for smoothing the raw data.
Smoothing and Normalization
By adding an SN suffix to the function, you will generate the estimated property from a temporary smoothed and normalized copy of the data. The following is for the the YAREASN function:
YAREASN(x1,x2,npts,deriv,yfac,zero) smoothed Y value area x1->x2, x2>x1, y normalize
YAREASN(x1,x2,npts,yfac) smoothed Y value area x1->x2, x2>x1, y normalize
There is both a simple and full format for the SN functions. The simple format specifies the npts of the Savitzky-Golay smoothing window and the yfac for the normalization. The full format also specifies the deriv, set to 0 for the function, 1 for the first derivative, and 2 for the second derivative. It also allows the normalization to be zeroed at its minimum. In the SN functions, the smoothing always precedes the normalization.
Smoothed Linear Baseline Correction Between Two Minima
By adding a BL suffix, a simple baseline connecting two minimums in smoothed data will be subtracted prior to the computation of the property. The following is for the the YSUMGT0BL function:
YSUMGT0BL(x1,x2,x1l,x2l,x1r,x2r,npts,deriv) smoothed Y value sum x1->x2, Y values >0, x2>x1, 2ptminbaseline
This computes the sum of the Y values greater than 0, between x1 and x2. The data are first smoothed with an npts window, deriv between 0 and 2, and a baseline is subtracted from the smoothed data formed by the first minimum to be detected between x1l and x1r, and a second minimum to be detected between x2l and x2r.
Smoothed Linear Baseline Correction Between Two X,Y Points
By adding a BLXY suffix, a simple baseline connecting two X,Y points in smoothed data will be subtracted prior to the computation of the property. The following is for the the XCTRMASSGTY0BLXY function:
XCTRMASSGTY0BLXY(x1,x2,y0,x1l,y1l,x2r,y2r,npts,deriv) X ctr of mass for smoothed Y >y0, x1->x2, x2>x1, 2ptXYbaseline
This computes the X center of mass for all Y values greater than y0, between x1 and x2. The data are first smoothed with an npts window, deriv between 0 and 2, and a baseline is subtracted from the smoothed data formed by the first x,y point x1l,y1l and a second x,y point x2r,y2r.
 |