PeakLab v1 Documentation Contents AIST Software Home AIST Software Support
Graph All Data Sets in Spectroscopic Data Matrix
The Model menu's Graph Data Matrix | Graph All Data Sets in Spectroscopic Data Matrix option will plot a graph of the imported data matrix.
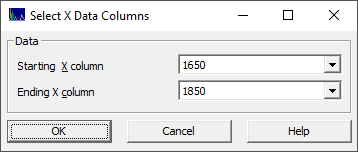
When this option is invoked, you will first see a dialog where you must specify the starting and ending X columns for the graph. For spectral data, this will specify the WL range you wish to inspect:

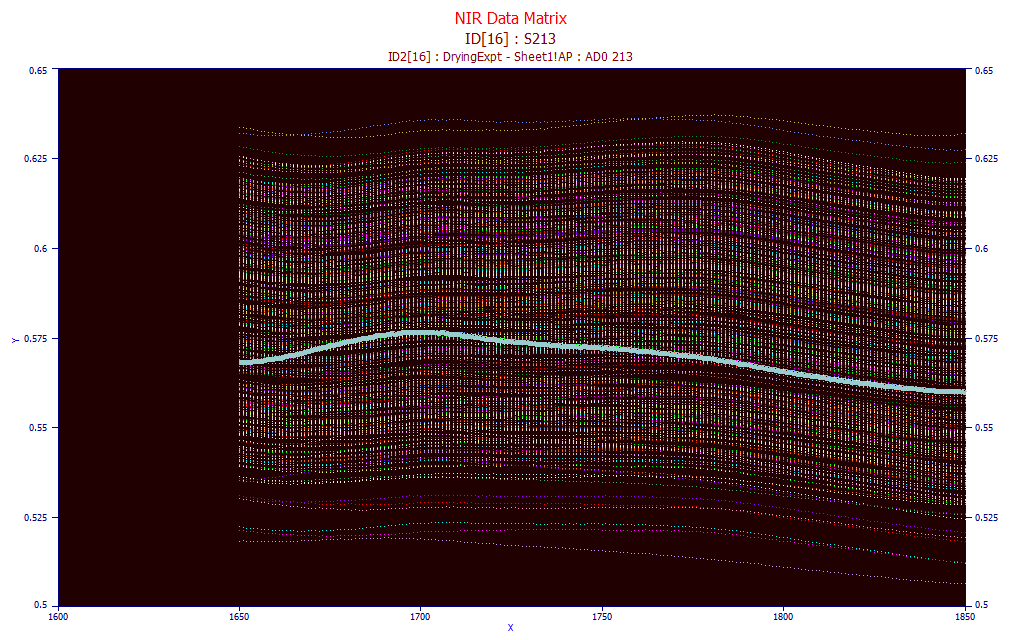
The default plot will not use connected lines. This makes it much easier to see a very large amount of data and spot spectra that may be suspect or which you wish to closely inspect relative to all of the other data in the matrix.
Normalization
There are five options for normalizing the data:
None - the data exactly as imported (and as it will be modeled)
Unit Area - each spectrum is normalized to unit area (area=1.0)
Unit Magnitude - each spectrum is normalized to min=0 and max=1
Zero Mean - each spectrum is normalized to a mean of 0.0 in the WL band imported
Mn=0 SD=1 - each spectrum is normalized to a mean of 0.0 and an SD of 1.0 in the WL band imported
The WL band specified for import determines what you will see in each of these normalizations.
Adjustments
The Force Zmin=0 option is used to force the graph spectral magnitudes to begin at 0.0 (the Z in the matrix, the Y in the individual spectra) irrespective of the data. This will allow you to see zero absorbance, reflectance, or transmission in a single step.
Identification
If the Use Mouse option is checked, the spectrum nearest the mouse will be highlighted. The first ID string will be shown in the second title and the second ID string in the matrix, if present, will be shown in the third graph title.

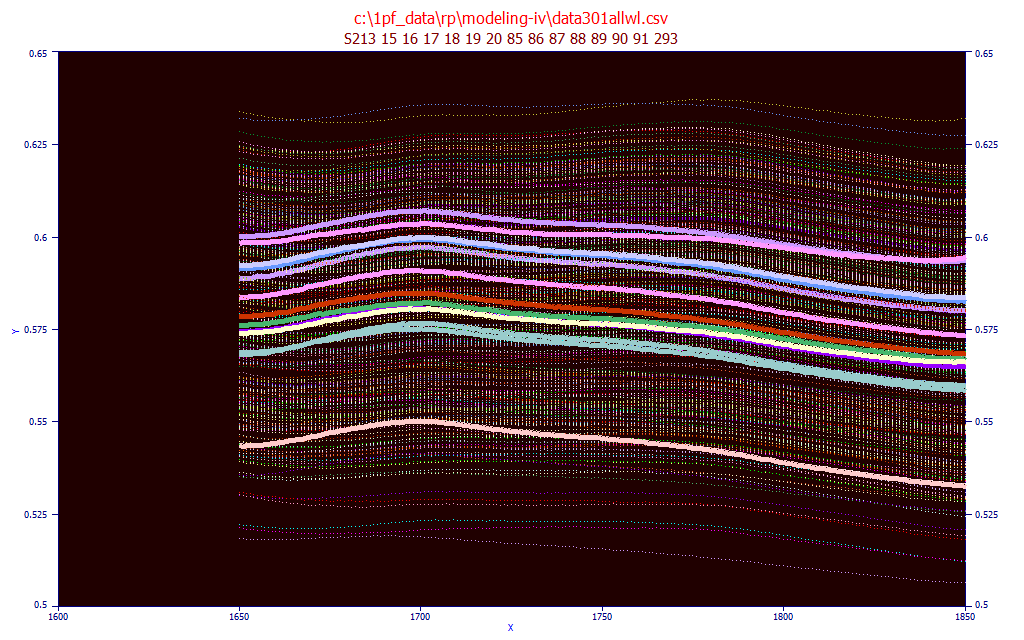
If you want to permanently highlight one or more spectra, turn off the Use Mouse option, enter a identifying substring from the first and second ID strings in the data matrix. For example, the sample 213 in this data matrix had a number of appearances from a drying and humidity chamber experiment. This is the result of entering "S213" in the Indentification field and clicking the Find button.

All of the samples with the string "S213" are now highlighted, and it is observed that all have the same unusual appearance in the matrix. These will remain highlighted for any print or export that may follow. To disable the highlight, turn the Use Mouse back on.
 |