PeakLab v1 Documentation Contents AIST Software Home AIST Software Support
Import Spectroscopic Modeling Data
The Import Data Matrix | Import Spectroscopic Data Matrix... item in the Model menu is used to load a spectroscopic modeling data matrix into the program. This data is used for all full-permutation general linear models and for the smart stepwise forward models which use the full permutation models as their starting point.
CSV ASCII Format
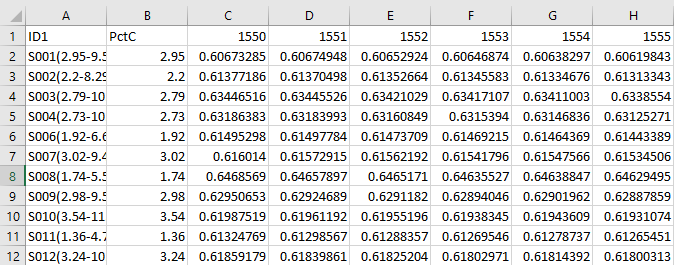
The program uses a straightforward CSV (comma separated value) ASCII format as its spectroscopic modeling data format. An example CSV file, imported into Excel, will appear similar to the following:

The first row must contain the string identifiers for the sample ID and the Y (dependent) variable. In this example, the PctC Y-column is the quantity of a specific component measured by a chromatographic analysis. While it is not required, it is strongly recommended that the spectral data column headers consist of the numeric values for either the wavelength or wavenumber. You can have any number of Y columns containing different dependent variables, although only one of these can be specified and fitted at any given time. You can also import two identifier columns which the program will concatenate into a single sample identifier for the modeling.
You will have a single column for each wavelength or frequency in the spectra. It is recommended that you retain the actual sampling density on the spectra within the CSV data matrix. The program will perform a separate extraction at a specified spacing of the spectra in the actual fitting. You will have one row, following the header row, for each sample of spectra to be fitted.
In Excel, you will find quite a few variations of the CSV format. We recommend that you use the format listed as CSV (Comma delimited) (*.csv) when saving data matrices for PeakLab modeling. This is the format that is written in all of the options in the program that save a modified data matrix.
MRU List
This import option maintains its own MRU (most-recently used) list to immediately import a recent modeling data file
Graphing the Data Matrix
After importing the data, you can use the Model menu's Graph Data Matrix | Graph All Data Sets in Spectroscopic Data Matrix option to view a graph of the data.
 |