PeakLab v1 Documentation Contents AIST Software Home AIST Software Support
Pearson VII
Pearson VII (Area)
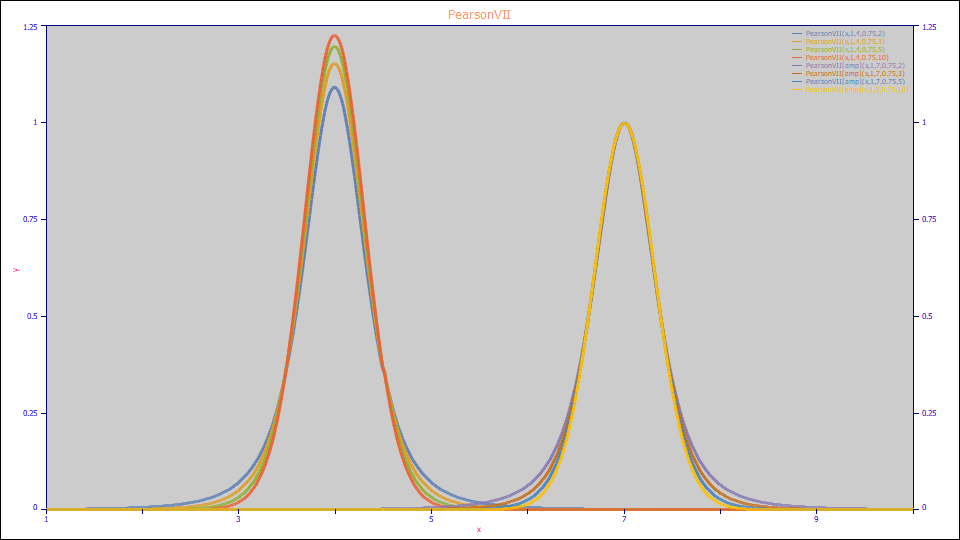
The Pearson VII symmetric model with a0 as the peak area is defined as follows:
a0 = Area
a1 = Center (mode)
a2 = FWHM
a3 = Shape (1=Lorentzian, infinity=Gaussian)
Built in model: PearsonVII
User-defined peaks and view functions: PearsonVII(x,a0,a1,a2,a3)
Pearson VII (Amplitude)
The Pearson VII symmetric model with a0 as the peak amplitude is defined as follows:
a0 = Amplitude
a1 = Center (mode)
a2 = FWHM
a3 = Shape (1=Lorentzian, infinity=Gaussian)
Built in model:PearsonVII[amp]
User-defined peaks and view functions: PearsonVII[amp](x,a0,a1,a2,a3)

More than one hundred years ago, Karl Pearson pioneered a system of frequency curves which is still used widely today. His Type VII symmetric model was once widely used as an empirical approximation for the Voigt function. The parameter a2 is the FWHM (full-width at half-maxima). When a3 is 1.0, the function is an exact Lorentzian. As this a3 power term asymptotically approaches infinity, the function becomes a Gaussian.
The Pearson VII function is a different parameterization of the Student-t distribution function, also included in PeakLab. Pearsonís work is found in many statistical references. One that may be of interest is J. K. Ord, Families of Frequency Distributions, Charles Griffin and Co., London, 1972. ISBN 0 85264 137 0.
Directly Fitting the Voigt
Although the Pearson VII or Student's t model can fit a Lorentzian and asymptotically approach a Gaussian, the intermediate a3 shapes do not come particularly close to a true mathematical convolution of the Lorentzian and Gaussian components of a spectral peak. You should use the Voigt function instead of the Pearson VII for fitting spectral peaks.
Spectral Fitting Considerations
When fitting spectral peaks, the x variable must be proportional to frequency, wave number, or energy. The y variable must be a quantitative measure. As such, you must convert wavelengths to wave number and transmission to absorption prior to fitting.
Depending on the extent of the tails in the Pearson VII, it is not uncommon for some portion of the fitted peakís area to lay outside the range of the spectrum being fitted. When this occurs, analytical peak areas will be greater than the measured areas which report a numeric integration using the lower and upper x limits of the data being fitted.


 |