PeakLab v1 Documentation Contents AIST Software Home AIST Software Support
Gaussian
Gaussian (Area)
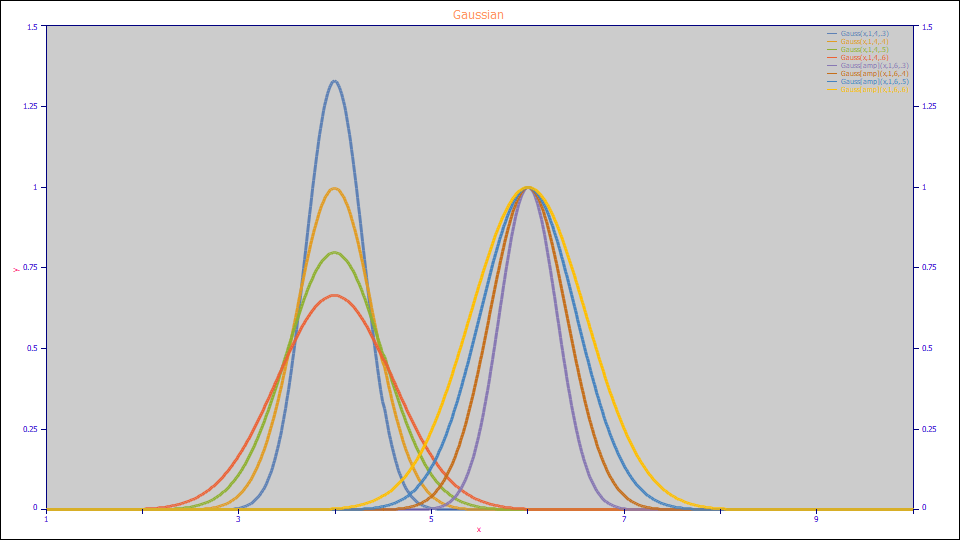
The Gaussian or normal peak with a0 as the peak area is defined as follows:
a0 = Area
a1 = Center (mean,mode,median)
a2 = Width (SD)
Built in model: Gauss
User-defined peaks and view functions: Gauss(x,a0,a1,a2)
Gaussian (Amplitude)
The Gaussian or normal peak with a0 as the peak amplitude is defined as follows:
a0 = Amplitude
a1 = Center (mean,mode,median)
a2 = Width (SD)
Built in model: Gauss[amp]
User-defined peaks and view functions: Gauss[amp](x,a0,a1,a2)

Normal Distribution
The Gaussian is also known as the normal distribution function. It is encountered in virtually every field of science. It is a symmetric function whose mean is a1, the center parameter. Its standard deviation is a2, the width parameter. PeakLab's area version of the Gaussian is the standard statistical form.
Instrumental Broadening
In spectroscopy, line broadening from instrument optical and electrical effects, usually referred to as the spread function or instrument response function, is generally Gaussian. The removal or undoing of this instrumental smearing is the objective of most deconvolution procedures.
Count Statistics
In high energy spectra where events are counted, a binomial distribution would reflect the variance due to count statistics. In the limit of n approaching infinity, the binomial distribution converges to the Gaussian.
Doppler Broadening
Gaussian peak shapes do not occur exclusively from instrumental broadening and count statistics. In the optical spectra of gases, an inherent Gaussian line broadening is found.
Molecular velocities also follow a Gaussian form (Maxwell distribution). The Doppler effect states that light from molecules in motion toward the observer will be shifted upwards in frequency at the point of observation, whereas the light from molecules in motion away from the observer is shifted downward. The probability per unit frequency of observing light at a frequency ? is given by the following Gaussian form (Jansson reference):
where the Doppler half-width
and m is the molecular mass, k is Boltzmannís constant, T is the absolute temperature of the gas, and c is the velocity of light.
Spectral Fitting Considerations
Note that the x in the Gaussian above is in frequency units. When fitting spectral peaks, the x variable must be proportional to frequency, wave number, or energy. The y variable must be a quantitative measure. As such, you must convert wavelengths to wave number and transmission to absorption prior to fitting.
When spectra consist of an energy emission due to a transition between energy states, the natural line shape is Lorentzian. Molecular collisions in gases add additional Lorentzian broadening. This means that most spectral lines will have some measure of Lorentzian character. Unless the Gaussian instrumental response broadening completely dominates the line shape, the Voigt function is the theoretical line shape for most spectral peaks.
When the line shape has any Lorentzian character, fitting amplitude models is preferable.
Central-Limit Theorem
The central-limit theorem states that when a function f(x) is convolved with itself n times, in the limit n->infinity, the convolution product is Gaussian with variance n times the variance of f(x), provided that the area, mean, and variance of f(x) are finite.
In practice, only a small number of self-convolution sequences produce a near-Gaussian shape. This is true even of the rectangular distribution. Any process that could thus be viewed as a series of successive self-convolutions would thus be expected to produce a Gaussian shape.
While the transport phenomena within a chromatographic column can be viewed as producing a series of mathematical self-convolutions, the non-idealities producing band broadening (diffusion, dispersion, mass transfer resistances, kinetic adsorption and desorption resistances, and extracolumn effects) generally produce a net spread function that is asymmetric.
Suggested References
Further information on spectral line broadening, and the measuring and deconvolution of Gaussian instrument response functions can be found in Peter A. Jansson, Deconvolution with Applications in Spectroscopy, Academic Press, 1984, ISBN 0-12-380220-2.
Mathematical properties of the normal statistical distribution function can be found in Merran Evans, Nicholas Hastings, and Brian Peacock, Statistical Distributions, p.114-118, John Wiley and Sons, 1993, ISBN 0-471-55951-2.
Further information on the normal distribution function is available in Norman L. Johnson and Samuel Kotz, Continuous Univariate Distributions, Vol 1, p.40-111, Houghton Mifflin, 1970.

![GenHVL[W]](prev.gif)
 |