PeakLab v1 Documentation Contents AIST Software Home AIST Software Support
View Function(X)
The Data menu's View Function(X) option is used to graph up to 25 functions of x across the x range of your choice. The graph can be scaled, formatted, printed, or copied to the clipboard. You may also plot the derivatives or cumulative area of the functions and you may numerically evaluate a function you have entered.

Function(X) Entry
Enter up to twenty-five functions of X you wish to graph. You may enter any numeric calculation. All of the functions and constants available within PeakLab which are available in the parser can be accessed.
Each Function(X) line is limited to single line Y[n]= expression up to 500 characters in length. The Y[n]= prefixes are automatically supplied.
Parser Functions Help
PeakLab's full parser for user-defined peaks is available for view functions. You can use any supported function which is available at the time of the procedure, including any presently compiled user-defined peaks.
There are two dropdowns. The first lists the class of function, and the second lists the specific function in that class. The default All Constants, Variables, and Functions lists everything in the parser. The Insert Button will automatically place the function, with any parameter list, in the Y[n]= field where you presently have the cursor.
Validation
If the functions are not successfully validated, the math or parser error causing the failure will be shown and the cursor will be placed at the location in the function where the error was detected.
Copy, Cut, Paste
Use the Copy, Cut, and Paste buttons to paste in text expressions from the clipboard, or to copy or modify the function text.
Maple and Mathematica
If you paste expressions from Maple, copy the final expression as text in Maple's language code. For Mathematica copy the final expression as plain text. For most function expressions, the 500 character limit should not come into play. The text from Maple should not require any special handling; the PeakLab parser has been extended to handle the Maple text directly. When you paste in text from Mathematica, you will need to use the Paste MM button. This converts Mathematica's syntax to that which is compatible with PeakLab. Note that certain functions in the Maple and Mathematica function sets may not be available in the PeakLab parser, although every function we found that was applicable to peak modeling should be available.
Note that certain functions in the parser may have two or three different names. One may be compatible with prior versions of the product, another will support Maple's nomenclature, and yet another will support Mathematica's. The functions will be identical and you can use them interchangeably.
Built-in Functions
The parser's built-in functions will be identical to those used in the fitting. For example, the GenHVL[Z] model is used as follows: GenHVL[Z](x,area,center,width,distortn,z-asym). Because the <irf> models are convolution integrals fitted in the Fourier domain, those models will not be available in this option. There may, however, be a few specialty integral peak models in the Integral Convolution models. For example, the GenHVLZ[ge]i(x,area,ctr,width,distortion,asym,g-sd,e-tau,fracg) creates a time-domain integral of the GenHVL[Z]<ge> model. Such integrals will be very slow.
User Defined Peaks
When creating user-defined peaks, you can plot and view then using this feature.
![]() Be sure you have entered and exited the User Function procedure to be certain the user-defined
peaks are compiled and available to this procedure. Even if these user-defined peaks are imported in the
PDF data file, they are not compiled until used.
Be sure you have entered and exited the User Function procedure to be certain the user-defined
peaks are compiled and available to this procedure. Even if these user-defined peaks are imported in the
PDF data file, they are not compiled until used.
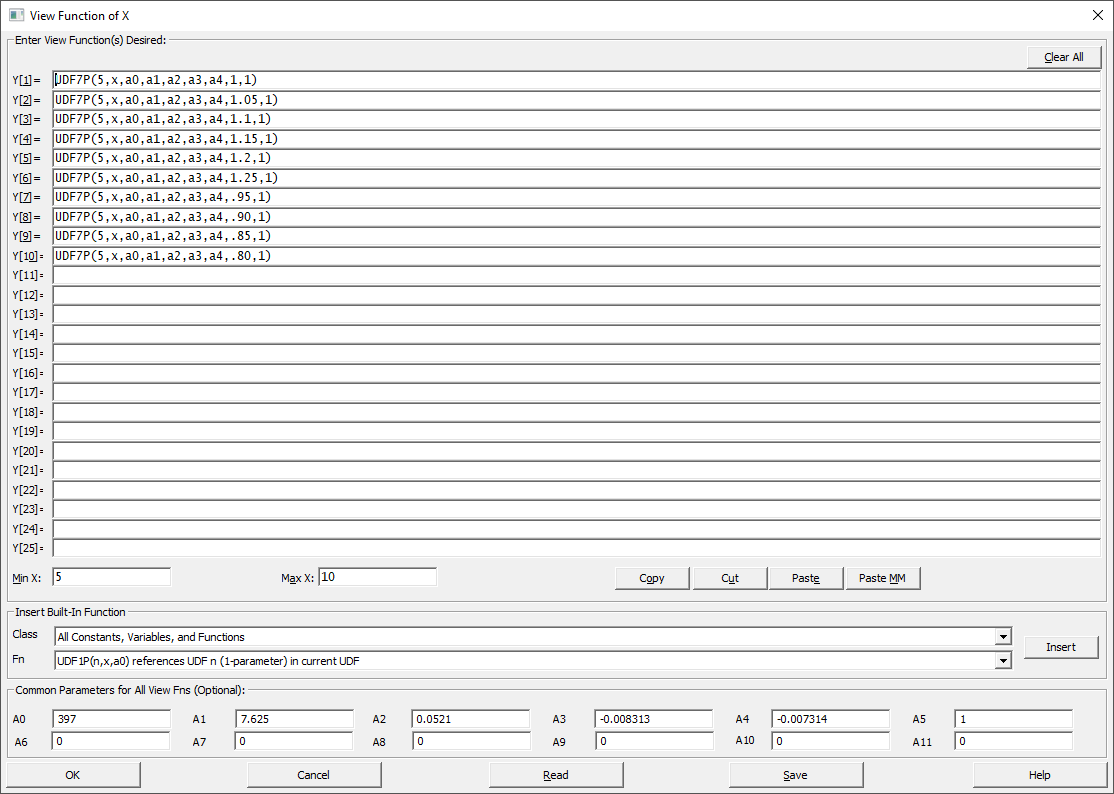
To view a user function, you use the UDF1P, UDF2P, ... UDF8P() parser functions. The number in the function name is the count of adjustable parameters. The first argument is the user function number (1 to 60), the second is usually x, and the remaining arguments are usually the a0, a1, a2, etc. parameter arguments.
For example, the following function plots user function 27, a 6-parameter model: UDF6P(27,x,1,1,.256,-.1*7/1,.023,-.055)
Common Parameters for All View Functions
When entering a large number of functions, or when you wish to have the flexibility of changing a parameter common to each of the functions, this option allows you to enter the models similar to the example above and place the common parameters in the A0 to A11 parameter fields. If you wish to subsequently see how all of the functions change when the a3 distortion is doubled, for example, you only need to change the common A3 field's value.
Save
Use the Save button to save a VFX file to disk. These are ASCII files. You should edit these only in the program.
Read
Use the Read button to import a VFX file from disk. The functions are assumed valid even if they contain user-defined models which may not currently be imported or compiled. If that occurs, you will see zeros for all function values.
Clear All
Use the Clear All button to erase all fields in the dialog.
View Function Graph
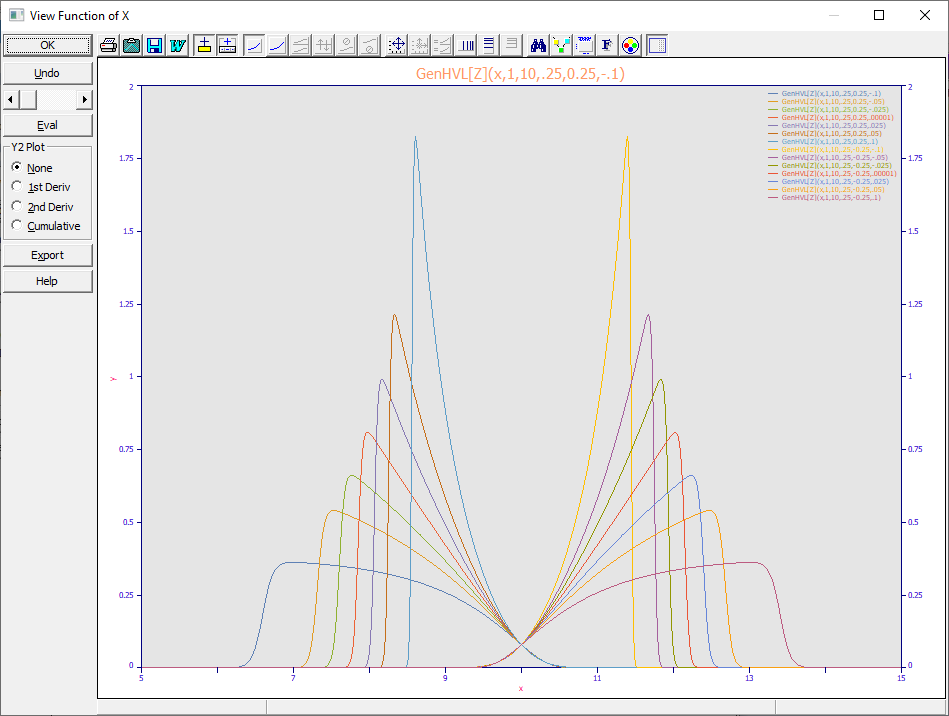
When you click OK from the entry dialog, you will see the following:

Y2 Plot
There are four options for displaying the Function(X) functions:
None - displays only the functions in a single plot graph
1st Deriv - displays the functions (Y axis) and first derivatives (Y2 axis) in a dual plot graph
2nd Deriv - displays the functions (Y axis) and second derivatives (Y2 axis) in a dual plot graph
Cumulative - displays the functions (Y axis) and cumulative areas (Y2 axis) in a dual plot graph
Simply select one of the four options to create the desired PeakLab Graph.
Note that cumulative areas require the evaluation of an integral for every pixel drawn in the plot. With a number of functions, with mathematically complex functions, or with large high-resolution graphs, these integrations may require some time. The integrations are done from a lower limit which corresponds with the lower limit of the displayed graph. By changing the lower X of the graph, you are thus changing this lower limit of integration.
The functions will be plotted in colors which correspond with the component colors in the PeakLab graph. These may be different for each of the graph's available color schemes and these are user-customizable.
Undo
Use the Undo item to return to the Function entry screen in order to revise the functions or X range.
Zoom
Ten levels of zoom-out are available by using the scrollbar in the graph's control panel. If this is a Cumulative graph , there may be an appreciable delay in updating the graph following a change in the zoom setting.
Evaluation
The Eval item is used to perform a full-featured numeric evaluation of one of the functions. If two or more functions are present, you must choose one for this numeric evaluation.
Export
For experimental work, the Export option will create 10,001 point data ASCII (PRN) sets of each of the functions in a directory of your choosing. Each of the data sets will have as much of the expression in the automatically generated file name as possible. These files can be imported back into the program with the main ASCII import option (File|Import Data Set(s)|Import from ASCII/AIA Data Files). If the functions are integrals, this process will take some time.


 |