PeakLab v1 Documentation Contents AIST Software Home AIST Software Support
Modify Contour Properties
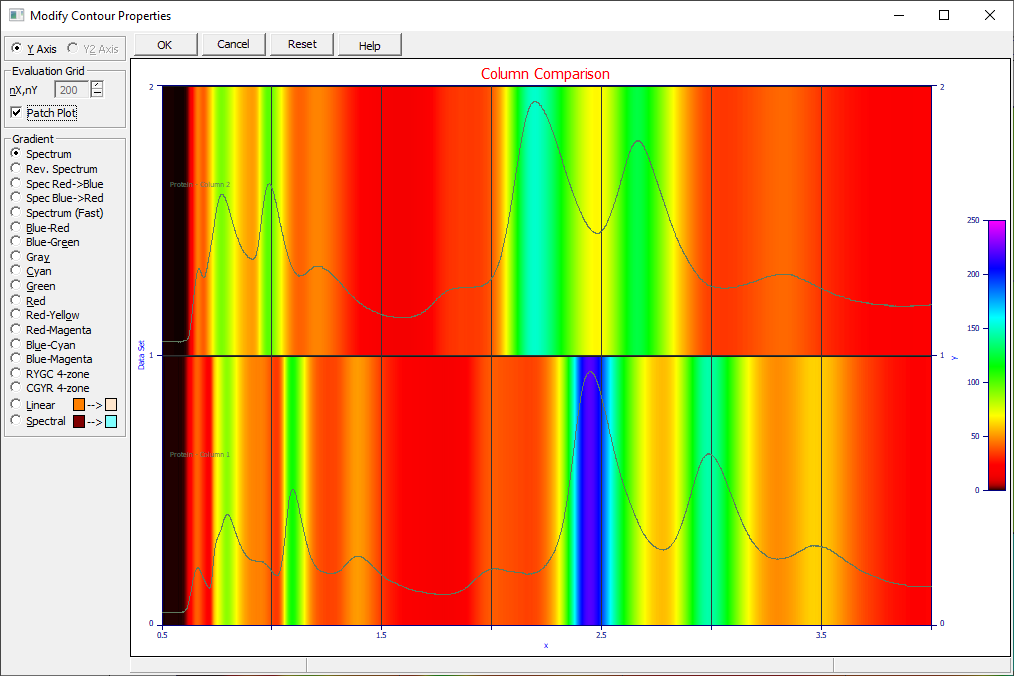
![]() The Select Color Gradient for Surface or Contour toolbar is button to change the gradient used
in 2D contour plots. This option incorporates a copy of the current graph. If multiple graphs are present,
this dialog will show only the first of the graphs.
The Select Color Gradient for Surface or Contour toolbar is button to change the gradient used
in 2D contour plots. This option incorporates a copy of the current graph. If multiple graphs are present,
this dialog will show only the first of the graphs.

Evaluation Grid
For the 2D graphing engine, only a square mesh is supported. The nX,nY item is used to set the x and y mesh count of the grid used to evaluate the parametric or non-parametric model interpolating or approximating the 3D surface. A mesh of 200x200 results in 40,000 vertices where Z must be computed and many times that count of polygons that must be filled. The higher the density of colors in the gradient, the higher the polygon count.
The maximum mesh supported of 500x500 produces 250,000 vertices. Very high mesh counts may assist in revealing regions of the surface that are unstable or undefined. Right clicking the spin button or edit field will offer a menu of available mesh sizes.
Patch Plot
The Patch Plot option will be available for the color patch rendering where the Y-variable consists of a specific data set. Since the Y variable is constant for that data set, there is no need to invoke the 3D rendering engine. As such, patch plots, such as the one above, render much more quickly.
Gradient
A gradient plot will involve drawing some number of minor polygons with each major polygon where a gradient transition occurs. The total number of polygons that must be rendered in a gradient contour can be quite high, especially when using a high color gradient. Gradient plots are thus computationally demanding and rendering performance may suffer when a high mesh count is specified. The colors within the built-in gradients are not adjustable.
The gradient spectrum plots and their color count at high, medium and low resolution are as follows:
Spectrum (spectrum, red to magenta, HiRes=1410, MedRes=512, LoRes=256)
Rev. Spectrum (spectrum, magenta to red, HiRes=1410, MedRes=512, LoRes=256)
Spec Red->Blue (spectrum, red to blue, HiRes=1128, MedRes=400, LoRes=200)
Spec Blue->Red (spectrum, blue to red, HiRes=1128, MedRes=400, LoRes=200)
Spectrum (Fast) (spectrum, red to magenta, HiRes=512, MedRes=256, LoRes=128)
Blue-Red (linear, blue to red, All=256)
Blue-Green (linear, blue to green, All=256)
Gray (linear, grayscale, All=200)
Cyan (linear, cyanscale, All=200)
Green (linear, greenscale, All=200)
Red (linear, redscale, All=200)
Red-Yellow (linear, red to yellow, All=200)
Red-Magenta (linear, red to magenta, All=200)
Blue-Cyan (linear, blue to cyan, All=200)
Blue-Magenta (linear, blue to magenta, All=200)
RYGC 4-zone (4-gradients red,yellow,green,cyan, All=256)
CGYR 4-zone (4-gradients cyan,green,yellow,red, All=256)
Linear Custom
The Linear Custom gradient creates a linear color scale between two colors of your selection. This option linearly interpolates between the boundary colors based upon their red, green, and blue (RGB) values. The gradient will consist of 512 colors. Click on the color buttons to select the two colors desired.
Spectral Custom
The Spectral Custom gradient creates a spectral color scale between two colors of your selection. This option linearly interpolates between the colors based upon their hue, saturation, and brightness values. The gradient will consist of 1024 colors. Click on the color buttons to select the two colors desired.


 |