PeakLab v1 Documentation Contents AIST Software Home AIST Software Support
Modify Surface Properties
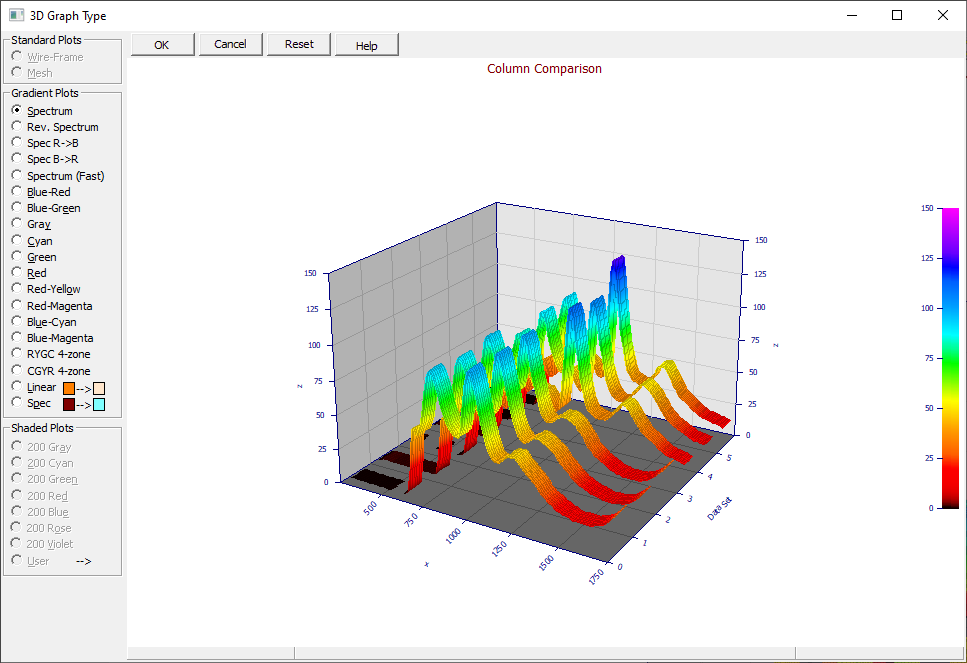
![]() The Select Color Gradient for Surface or Contour toolbar is button to change the type of 3D surface
plots. This option incorporates a copy of the current graph. If multiple graphs are present, this dialog
will show only the first of the graphs.
The Select Color Gradient for Surface or Contour toolbar is button to change the type of 3D surface
plots. This option incorporates a copy of the current graph. If multiple graphs are present, this dialog
will show only the first of the graphs.

Gradient Plots
Only full gradient plots are deemed sufficient for visualization in PeakLab. The wire-frame and mesh plots are not used.
A gradient plot will involve drawing some number of minor polygons with each major polygon where a gradient transition occurs. The total number of polygons that must be rendered in a gradient surface can be quite high, especially when using a high color gradient. Gradient plots are thus computationally demanding and rendering performance may suffer when a high mesh count is specified. The colors within the built-in gradients are not adjustable.
The gradient spectrum plots and their color count at high, medium and low resolution are as follows:
Spectrum (spectrum, red to magenta, HiRes=512, MedRes=256, LoRes=128)
Rev. Spectrum (spectrum, magenta to red, HiRes=512, MedRes=256, LoRes=128)
Spec Red->Blue (spectrum, red to blue, HiRes=400, MedRes=200, LoRes=100)
Spec Blue->Red (spectrum, blue to red, HiRes=400, MedRes=200, LoRes=100)
Spectrum (Fast) (spectrum, red to magenta, HiRes=256, MedRes=128, LoRes=128)
Blue-Red (linear, blue to red, All=256)
Blue-Green (linear, blue to green, All=256)
Gray (linear, grayscale, All=200)
Cyan (linear, cyanscale, All=200)
Green (linear, greenscale, All=200)
Red (linear, redscale, All=200)
Red-Yellow (linear, red to yellow, All=200)
Red-Magenta (linear, red to magenta, All=200)
Blue-Cyan (linear, blue to cyan, All=200)
Blue-Magenta (linear, blue to magenta, All=200)
RYGC 4-zone (4-gradients red,yellow,green,cyan, All=256)
CGYR 4-zone (4-gradients cyan,green,yellow,red, All=256)
Linear Custom
The Linear Custom gradient creates a linear color scale between two colors of your selection. This option linearly interpolates between the boundary colors based upon their red, green, and blue (RGB) values. The gradient will consist of 200 colors. Click on the color buttons to select the two colors desired.
Spectral Custom
The Spectral Custom gradient creates a spectral color scale between two colors of your selection. This option linearly interpolates between the colors based upon their hue, saturation, and brightness values. The gradient will consist of 200 colors. Click on the color buttons to select the two colors desired.
![]() Most of the 3D surface properties are set in the 3D graph's Modify
Graph View toolbar option. For a fully filled 3D gradient surface, uncheck the Ribbon in the Modify
Graph View toolbar option. A ribbon plot is useful for comparing multiple data sets where a fully
filled plot is more useful for the general rendering a single response surface.
Most of the 3D surface properties are set in the 3D graph's Modify
Graph View toolbar option. For a fully filled 3D gradient surface, uncheck the Ribbon in the Modify
Graph View toolbar option. A ribbon plot is useful for comparing multiple data sets where a fully
filled plot is more useful for the general rendering a single response surface.
Shaded Plots
In a shaded plot, the brightness of each mesh element is adjusted for the spectral illumination that would be produced by the light source specified in the 3D graph's Modify Graph View option. This light source is specified by angular shifts from the main view angles. The default XY angular shift of +30 degrees and Z angular shift of +15 degrees is similar to holding a point source of illumination above and to the right of the viewer. Shaded plots are faster than gradient plots since the number of polygons to be drawn is no higher than that of a standard mesh plot.
The available shaded plots are:
Gray (linear, grayscale, All=200)
Cyan (linear, cyanscale, All=200)
Green (linear, greenscale, All=200)
Red (linear, redscale, All=200)
Blue (linear, bluescale, All=200)
Rose (linear, rosescale, All=200)
Violet (linear, violetscale, All=200)
User Custom
The User Custom shaded gradient creates a linear color scale between two colors of your selection. This option linearly interpolates between the boundary colors based upon their red, green, and blue (RGB) values. The gradient will consist of 200 colors. Click on the color buttons to select the two colors desired.
With the large number of colors present in the gradient and shaded plots, it is possible that conflicts will arise with the various colors used in data points, drop lines, and other elements in the graphs. You should use the 3D Graph Customize Colors option to design graph elements that work well with the particular gradient of colors you choose for the surface.
Restoring Defaults
The Reset button restores the program's default gradient or shaded option.


 |