PeakLab v1 Documentation Contents AIST Software Home AIST Software Support
ZDD - Gen2 Default - Generalized Error
This is the Zero Distortion Density (ZDD) used in the default Gen2HVL models. This generalized normal's a1 center parameter is the mean of the asymmetric peak. The [Y] ZDD is a similar model with a parameterization where a1 is the center of the underlying normal. The a4 parameter in the ZDD nomenclature adjusts the third moment or skew. The a3 parameter in the ZDD nomenclature adjusts the fourth moment or kurtosis by varying the power of decay of the tails.
This is also the ZDD used in the default Gen2NLC models. For the Gen2NLC models, a0, a1, and a3 will be identical. The a2 width or second moment term will reflect a kinetic time constant, and a4 will reflect an NLC asymmetry normalized to 0.5 for the Giddings ZDD. Please see the GenHVL and GenNLC equivalence topic for further details.
Twice Generalized Default ZDD (Two Higher Moments)
a0 = Area
a1 = Center (as mean of asymmetric peak)
a2 = Width (SD of underlying Gaussian)
a3 = Power of Decay of Tails, controls kurtosis or fourth moment
a4 = Asymmetry ( fronted -1 > a3 > 1 tailed), controls skew or third moment

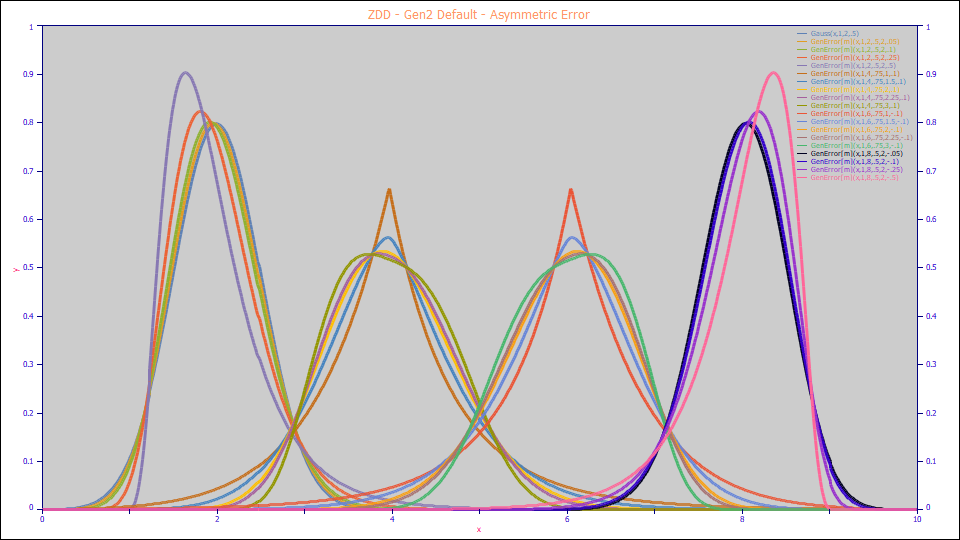
In this graph, the outer peaks vary the asymmetry a4 at positive and negative values. The peaks in the center of the plot vary the a3 tailing at a fixed positive and negative asymmetry.
Built-In Peak Model
GenError[m] (Statistical family)
User-Defined Peaks and View Functions
GenError[m](x,area,mean,width,n-power,z-asym) Asym Generalized
Error
GenError[m]_C(x,area,mean,width,n-power,z-asym) Asym
Generalized Error
GenError[m]_CR(x,area,mean,width,n-power,z-asym) Asym
Generalized Error
This Asymmetric Error Model is part of the unique content in the product covered by its copyright.
Example Fit
Data generated from a Generalized Error peak are fitted. This is the shape of the Gen2HVL or Gen2NLC models when there is zero chromatographic distortion. In this example, the generated data use a power of decay of 2.2, a value higher than the 2.0 Gaussian decay, and what might be expected with gradient HPLC peaks.
"GenError(x,1,5,.25,2.2,0.1)"
Fitted Parameters
r^2 Coef Det DF Adj r^2 Fit Std Err F-value ppm uVar
1.00000000 1.00000000 1.0065e-15 2.266e+32 0.00000000
Peak Type a0 a1 a2 a3 a4
1 GenError[m] 1.00000000 5.01253130 0.25000000 2.20000000 0.10000000
Measured Values
Peak Type Amplitude Center FWHM Asym50 FW Base Asym10
1 GenError[m] 1.40379500 4.95649171 0.67941140 1.24009278 1.29512868 1.32688030
Peak Type Area % Area Mean StdDev Skewness Kurtosis
1 GenError[m] 1.00000000 100.000000 5.01415908 0.27628895 0.28335254 2.96345806
Analytic Moments
Peak Type FnArea % FnArea
1 GenError[m] 1.00000000 100.000000
Deconvolved Moments
Peak Type Area Mean StdDev Skewness Kurtosis
1 GenNorm 1.00000000 5.01253130 0.25188257 0.30175910 3.16232386
Peak Type Area Mean StdDev Skewness Kurtosis
1 Gauss 1.00000000 5.00000000 0.25000000 5.6424e-8 2.99999967
The a1 of the GenError[m] ZDD is the mean of the Generalized Normal (the GenError with identical parameters except for an a3=2 Gaussian decay). When a3=2, the GenError[m] a1 will be the first moment or mean of the peak.


![ZDD - [Z]](next.gif) |