PeakLab v2 Documentation Contents R2N Software Home R2N Software Support
First Derivative Spectra
First Derivative Chromatographic Spectra
When you import
3D chromatographic PDA/DAD spectra, D1 first derivative data are automatically created using an automated
Savitzky-Golay algorithm that directly generates a first derivatives with respect to wavelength and a
second derivative with respect to time.
The main purpose of the D1 spectra is to find zones where the derivatives of the various components
pass through zero. This option has been designed to produce accurate first derivative spectra. The Savitzky-Golay
smoothing is necessary to produce the derivative matrix and cannot be disabled. Before the first derivative
is created, you will want to remove the background (baseline) at all WLs in the matrix.
For very noisy data, you may have to fit the noisy WL-specific extracted chromatograms or use the
Smooth
DSP menu option.
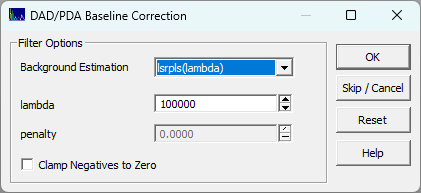
After selecting the source(s) for the 3D data, you will be presented with a small background correction dialog:
This will use a Whittaker baseline method of your choice to baseline correct all of the chromatographic spectra in the file. There will be one baseline correction for every wavelength in the file. This may perform many hundreds of automated baseline corrections. This is essential if you are working with 3D chromatographic spectra from gradient experiments where there is a baseline that strongly varies with the mobile phase strength.
Please see the Fitting Coeluting Peaks tutorial for using identified zero first derivative wavelength values for estimating the areas of coeluting peaks with slightly different UV-VIS spectra. You can use the Reduce DAD/PDA 3D Matrix option to directly evaluate the derivative surface. In the plot below, there are three first derivative zero crossings separated by only a few nm in wavelength, and yet this technique can isolate these components even when coeluting.
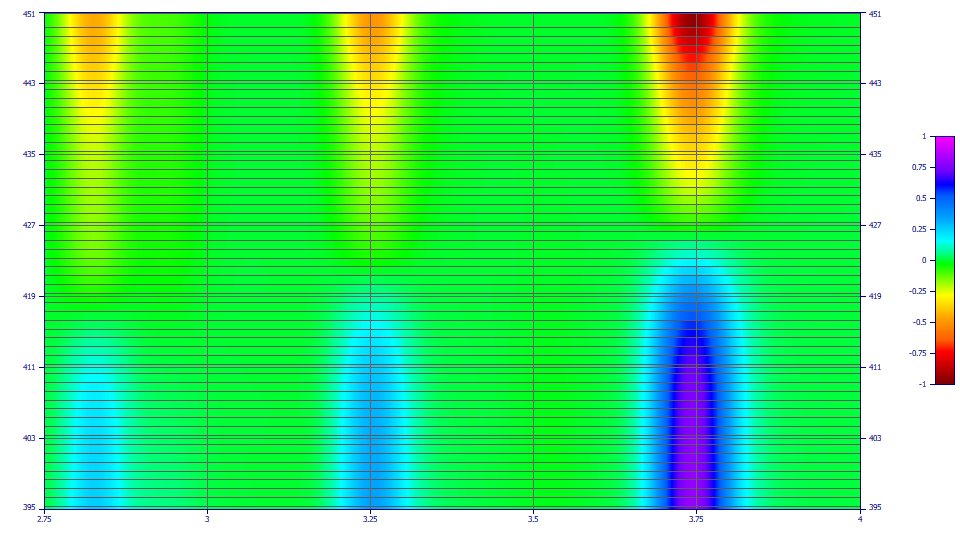
To confirm the wavelengths where a given component will be zeroed, zoom in the zero band on each component where you want to identify the wavelength and click Update. The Min(Abs(Z)) Y value will be the pertinent D1=0 wavelength value. The zero zone is easy to locate in a patch plot since the D1 peak is inverted on one side of the zero point. The D1 location is also the mode or apex location in the non-derivative data. It may be easier to get this value directly from a reference standard where just one of the two coeluting components is present. It may also be possible to get the spectra of the individual components from time regions in a high-resolution chromatographic separation where the two components have no overlap with one another.
A Special Thank You
AIST Software would like to personally thank Dr. M. Farooq Wahab at the University of Texas at Arlington for his motivation to offer this first derivative technique as it appears in PeakLab. Dr. Wahab echoed our sentiments that novel 3D diode array detector analyses are seriously underused in science. It is our hope that by making this first derivative coelution analysis as close to effortless as possible, its use will become more widespread in the chromatographic sciences. Dr. Wahab furnished us with a 1995 report from the Analyst, Real-time Analysis of Multicomponent Chromatograms: Application to High-performance Liquid Chromatography, which we believe is the first report of this method.