PeakLab v2 Documentation Contents R2N Software Home R2N Software Support
Chromatography Spectra Menu
The ChromSpec menu contains the following options:
Import Matrices
The 3D chromatographic spectral matrix data in PeakLab is maintained separately from the main 2D chromatography
and spectroscopy data sets. Use this Import Matrices. option to import the 3D data matrices from
ASCII or Agilent files.
Except for the Agilent .uv import option, you must use your instrument's software to convert the data
to an ASCII CSV file in order to import the data in PeakLab.
These data will remain in memory until you the Clear DAD/PDA Matrix Data menu item to free this memory or until you reinvoke this option to load different data sets.
From ASCII DAD 3D Matrix Files...
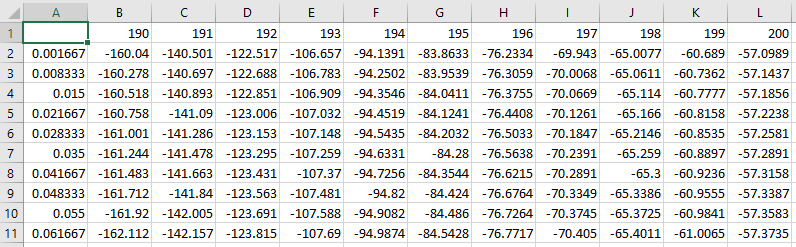
This option allows multiple 3D data matrices to be imported from ASCII CSV files. These files must follow the ASCII CSV Format used by the Agilent export macro:
The data must be a matrix stored as an ASCII CSV file (use Excel's default CSV export if necessary) with the first cell empty, the wavelength values in the first row, the time values in the first column, and the DAD information in the matrix between.
From Agilent uv/sp data in .d Folders...
For Chemstation import, select the .d folders where the 3D .uv data resides. All of the .d folders must reside in a common higher level folder. You can select up to 25 folders. PeakLab uses the python rainbow import for these files.
For OpenLab v1 import, PeakLab uses reverse-engineered data import of the Agilent sp files. Again, you must select the .d folders.
From Agilent uv/sp data in .dx Files...
For OpenLab v2 Import, unlike the other options, you must select the .dx data files.
Automatic Creation of D1(wl) and D2(time) Matrices
When you import 3D chromatographic PDA/DAD spectra for any one of the three import methods, derivative
matrices are also automatically created using an automated Savitzky-Golay algorithm that directly generates
a first derivatives with respect to wavelength and a second derivative with respect to time.
The main purpose of the D1 spectra is to find zones where the first
derivatives of the various components pass through zero. Please see the Fitting
Coeluting Peaks tutorial for using identified zero first derivative wavelength values for estimating
the areas of coeluting peaks with slightly different UV-VIS spectra.
Import Chromatographic Data Sets...
This option extract 2D slices (chromatograms at specific wavelengths). Use this Import Chromatographic Data Sets... option to extract the chromatography at different wavelengths, average the chromatography at a band of wavelengths, or to create a map of wavelengths where the maximum spectra occur across time.
Import Spectroscopic Data Sets...
This option extract 2D slices (spectra at specific elution times or bands). Use this Import Spectroscopic Data Sets.... option to extract the spectroscopy at different times or average the spectroscopy across a band of elution times.
Separate Compounds using MCR-ALS...
Use the Separate Compounds using MCR-ALS... option to mathematically separate coeluting compounds using the MCR-ALS algorithm. This algorithm is useful when you cannot find a wavelength in the UV/VIS that distinguishes one molecule from another.
Filter DAD/PDA Baseline
When using the ChromSpec menu's Filter DAD/PDA Baseline... option or after selecting the source(s) for the DAD data matrix in the import procedure, you will be presented with a small background correction dialog:
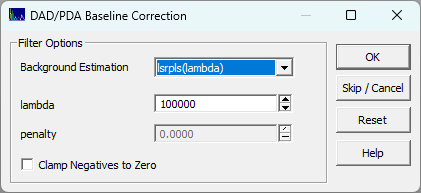
This will use a Whittaker
baseline method of your choice to baseline correct all of the chromatographic spectra in the file.
There will be one baseline correction for every wavelength in the file. This may perform many hundreds
of automated baseline corrections. This is essential if you are working with 3D chromatographic spectra
from gradient experiments where there is a baseline that strongly varies with the mobile phase strength.
Please note that there may be substantial differences in baselines at the different wavelengths, and
while the Whittaker lambdas generally a function of N, the number of data points, lambda proportional
to the log(N), it will also vary with the width of the peaks. You should Use the Skip/Cancel to omit this
step and then use the Import
Chromatographic Data Sets... option at wavelengths of interest to create sets that can be individually
evaluated with the Baseline
option. There is a baseline
optimization method where you can manually specify an optimal human designed baseline and a genetic
algorithm optimization will be made to determine the lambda and penalty values that most closely reproduce
the human baseline.
View DAD/PDA 3D Matrix...
Use this View DAD/PDA 3D Matrix... option for a full resolution contour display of all data in the matrix.
Reduce DAD/PDA 3D Matrix...
Use this Reduce DAD/PDA 3D Matrix... option to partition the 3D matrix to just the times and wavelengths of interest.
Export DAD/PDA 3D Matrix to ASCII File...
This Export DAD/PDA 3D Matrix to ASCII File... option will export a selected 3D data matrix in the ASCII CSV Format shown in the Import Matrices section above.
Create Composite Matrix from Multiple DAD Data...
This Create Composite Matrix from Multiple DAD Data... option will combine multiple data matrices into a single composite matrix.
If you have saved all replicates as 3D data, for example, you can use this option to create a composite single matrix containing the sum of the spectral values for each of the replicates. Since the raw DAD instrumental data can have the same sampling rate, but other than a pure 0.00 starting time value, this option only requires that the count of time and wavelength values match across the different matrices. The actual times will come from the reference matrix shown in the conversion status dialog. You will see a warning when the starting time values are not constant across the replicates.
This procedure also presents on option to automatically initiate the View DAD/PDA 3D Matrix... option to view the composite matrix. The composite matrices will be at the bottom of the spectra list.
Clear DAD/PDA Matrix Data
Use the Clear DAD/PDA Matrix Data option to clear all of the 3D Chromatographic data matrices stored
in memory. Note that the existing 3D Chromatographic matrices will be cleared if new data are imported.