PeakLab v1 Documentation Contents AIST Software Home AIST Software Support
Reference Lines
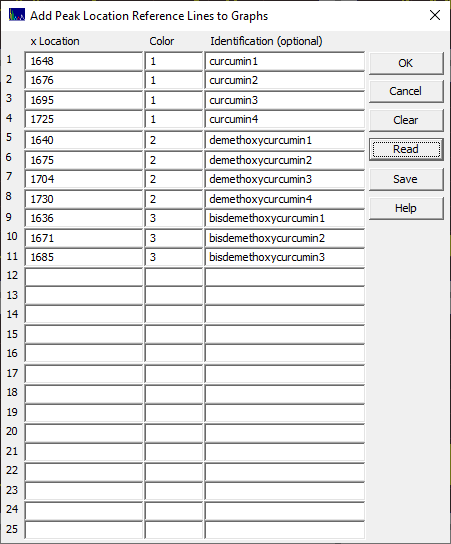
The right click Specify X Location Line References for Graphs option in the main window is used for placing vertical lines on a plot to identify specific expected elution times or spectral frequencies:

You may specify up to 25 locations. These will apply to the aggregated data in the View and Compare Data option, to each fitted plot in the Review, and to the Smooth option, primarily for checking the D2 second derivative locations in data with highly overlapping peaks.
The x Location is the x value in the plot where the vertical line will be drawn.
The Color can be set between 1-25, these corresponding with the Component 1 through Component 25 custom colors in the Graph Colors option.
If an Identification string is entered, it will be displayed immediately to the right of the line, using this same color.
Use the Save item to save the reference line information to disk. This will be a binary file with an LRF extension. It can only be written from the program.
Use the Read item to import the saved reference line information in the lrf file from disk.
If you specify reference lines, this information will be saved in the PFD file and automatically loaded when the PeakLab file is opened.
 |