PeakLab v1 Documentation Contents AIST Software Home AIST Software Support
View and Compare Data
This is PeakLab's visualization option for data. This option is used for visualizing the data in any one of the levels within the main data window. This procedure is accessed via the View and Compare Data button in the main data window or the Data|View/Compare Data in the main menu.
![]() You can also use the View/Compare Data icon in the main program toolbar.
You can also use the View/Compare Data icon in the main program toolbar.
In general, this option will be used if you have multiple data sets present. Only those data sets selected in the main screen will be rendered. The main window data selections are also used in the Local Maxima Peaks, Hidden Peaks - Residuals, and the Hidden Peaks - Second Derivative fitting options.
This procedure is only for visualization. The data are not altered. You may render the data from any data level, although you will need to select the sets to be viewed from the topmost data level.
PeakLab Graph
All of the graph adjustments are made in the PeakLab graph toolbar.
Contour
This first option is the principal visualization in this procedure. It offers a contour plot with the peak data overlaying the contour. Each data set is shown in succession on the Y-axis.
![]() You can also select the Display as 2D Contour button in the toolbar to restore this format.
You can also select the Display as 2D Contour button in the toolbar to restore this format.
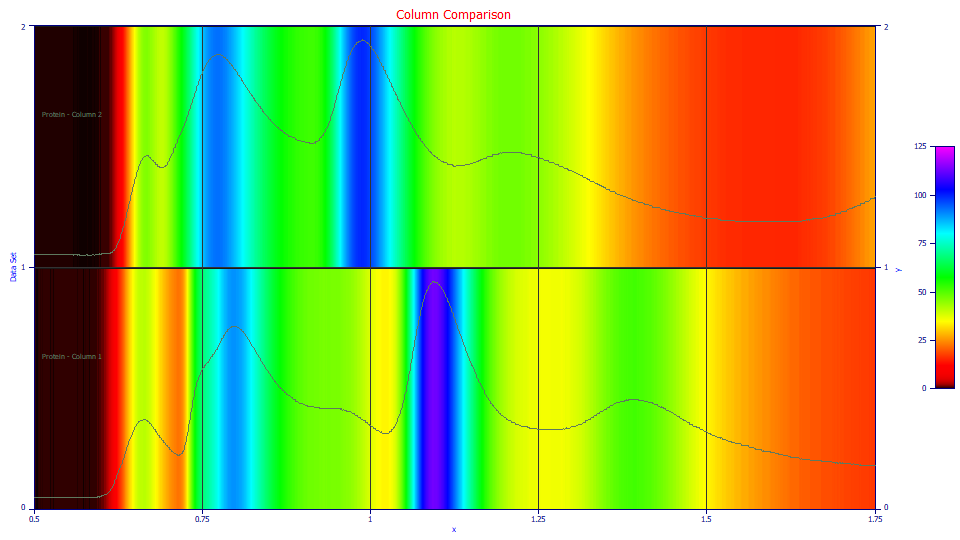
![]() The Contour is rendered with the 2D graphing engine. The 2D version of the Graph
View is used to configure the main plot elements.
The Contour is rendered with the 2D graphing engine. The 2D version of the Graph
View is used to configure the main plot elements.
![]() The Select
Color Gradient for Surface or Contour button in the graph toolbar offers the means to modify
the contour properties, including the color gradient used in the contour. User-defined linear and
custom gradients are an option. The Patch format, the default, is much faster than using the full
3D rendering engine.
The Select
Color Gradient for Surface or Contour button in the graph toolbar offers the means to modify
the contour properties, including the color gradient used in the contour. User-defined linear and
custom gradients are an option. The Patch format, the default, is much faster than using the full
3D rendering engine.
![]() The Overlay Data on Surface or Contour option in the graph toolbar will show or hide the data in
the plot.
The Overlay Data on Surface or Contour option in the graph toolbar will show or hide the data in
the plot.
![]() The Toggle Legend for Surface or Contour item in the graph toolbar will display or hide the gradient
legend to the right of the plot.
The Toggle Legend for Surface or Contour item in the graph toolbar will display or hide the gradient
legend to the right of the plot.
![]() The Show or Hide Legend Titles toolbar option will display or hide the titles for the different
data sets. The titles are first placed to left of the plot. Clicking this item again will place the titles
to the right. Clicking yet again will toggle the titles off.
The Show or Hide Legend Titles toolbar option will display or hide the titles for the different
data sets. The titles are first placed to left of the plot. Clicking this item again will place the titles
to the right. Clicking yet again will toggle the titles off.
![]() The Shift Patches to Align Maxima option in the graph toolbar will shift all of the contours to
align them with the first data set's maximum. The overlay of data is not impacted. Note that only the
first contour will map correctly to the x-axis values when this option is enabled. If you zoom-in the
plot, this option uses the maximum within the zoomed-in range. This shift will thus change with any zoom
if the maximum within the zoomed region changes in any one of the data sets.
The Shift Patches to Align Maxima option in the graph toolbar will shift all of the contours to
align them with the first data set's maximum. The overlay of data is not impacted. Note that only the
first contour will map correctly to the x-axis values when this option is enabled. If you zoom-in the
plot, this option uses the maximum within the zoomed-in range. This shift will thus change with any zoom
if the maximum within the zoomed region changes in any one of the data sets.
![]() The Hide Rendering of Patch option will hide the contour and display only the data.
The Hide Rendering of Patch option will hide the contour and display only the data.
3D Gradient
By default the 3D Gradient format displays ribbon plots which makes it easier to see peaks that would otherwise be hidden by filled 3D surfaces. A fully filled 3D gradient surface is available.
![]() You can also use the Display as 3D Gradient Surface button in the toolbar to select this format.
You can also use the Display as 3D Gradient Surface button in the toolbar to select this format.
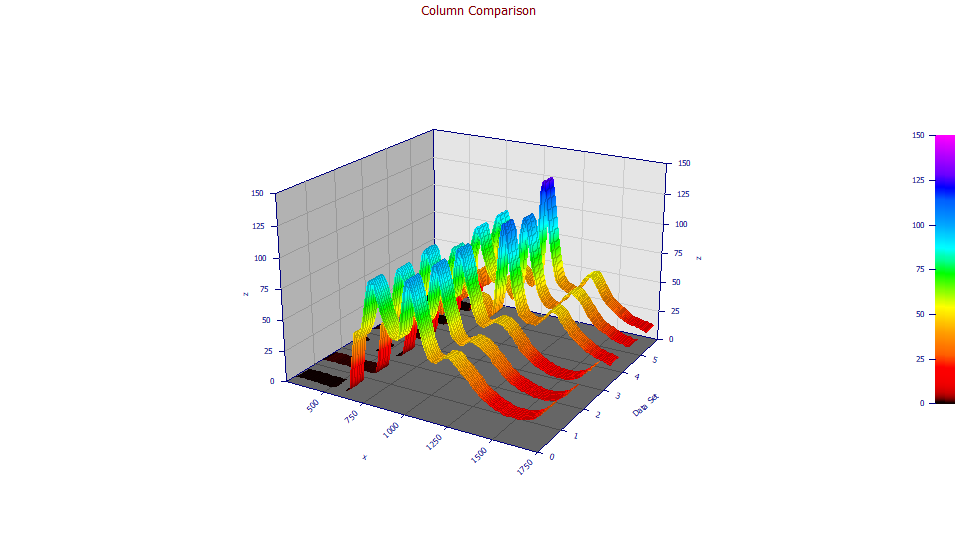
![]() For a fully filled 3D gradient surface, uncheck Ribbon in the Modify
Graph View toolbar option.
For a fully filled 3D gradient surface, uncheck Ribbon in the Modify
Graph View toolbar option.
![]() The Select
Color Gradient for Surface or Contour button in the graph toolbar offers the means to modify the
surface color gradient used in the surface. User-defined linear and spectral gradients are an option.
The shaded plots options will be unavailable when the 3D Gradient format is selected.
The Select
Color Gradient for Surface or Contour button in the graph toolbar offers the means to modify the
surface color gradient used in the surface. User-defined linear and spectral gradients are an option.
The shaded plots options will be unavailable when the 3D Gradient format is selected.
![]() The Overlay Data on Surface or Contour option in the graph toolbar will show or hide the data in
the surface plot.
The Overlay Data on Surface or Contour option in the graph toolbar will show or hide the data in
the surface plot.
![]() The Toggle Legend for Surface or Contour item in the graph toolbar will display or hide the gradient
legend to the right of the plot.
The Toggle Legend for Surface or Contour item in the graph toolbar will display or hide the gradient
legend to the right of the plot.
![]() The Modify
3D Animation Settings in the graph toolbar is used to specify an animation, the settings to be
used in rotating the surface in real time in 3D space. You should adjust the angular steps to fit the
speed of your graphics card. If you have a very fast card, you may be able to set 1 degree steps for a
very smooth animation of surfaces.
The Modify
3D Animation Settings in the graph toolbar is used to specify an animation, the settings to be
used in rotating the surface in real time in 3D space. You should adjust the angular steps to fit the
speed of your graphics card. If you have a very fast card, you may be able to set 1 degree steps for a
very smooth animation of surfaces.
![]() The Start/Stop Animation button in the graph toolbar is used to begin and end the real-time animation
of the surface in 3D space. When an animation is underway, simply click on the surface to pause the animation,
and click again to restart. All options other than the Stop are disabled when an animation is underway.
The Start/Stop Animation button in the graph toolbar is used to begin and end the real-time animation
of the surface in 3D space. When an animation is underway, simply click on the surface to pause the animation,
and click again to restart. All options other than the Stop are disabled when an animation is underway.
Wheel Button Mouse Rotation
If you have a mouse with a middle button wheel, you can change 3D view angles using this wheel button. You can do this from the View and Compare Data window when 3D graphs are being rendered.
To rotate the surface by XY angle, rotate the wheel upwards to increase the XY angle, downwards to decrease the XY angle. The rotation will be in 5 degree increments. If you hold the Ctrl button down while rotating the wheel the XY rotation will be in 10 degree increments.
To rotate the surface by Z angle, hold the Shift key down and rotate the wheel upwards to increase the Z angle, downwards to decrease the Z angle. The rotation will be in 5 degree increments. If you also hold the Ctrl button down while rotating the wheel the Z rotation will be in 10 degree increments.
If your wheel mouse has a tilt wheel, you can also increase the Z angle toward +90 degrees by holding the tilt button to the right and releasing it when you have the angle you wish. You can decrease the Z angle toward -90 degrees by holding the tilt button to the left until the desired angle is rendered. The rotation will be in 5 degree increments. If you hold the Ctrl button down while holding the tilt wheel left or right, the Z rotation will be in 10 degree increments.
3D Shaded
The 3D Shaded format displays surfaces which reflect the illumination of a light source upon the surface.
![]() You can also use the Display as 3D Shaded Surface button in the toolbar to select this format.
You can also use the Display as 3D Shaded Surface button in the toolbar to select this format.
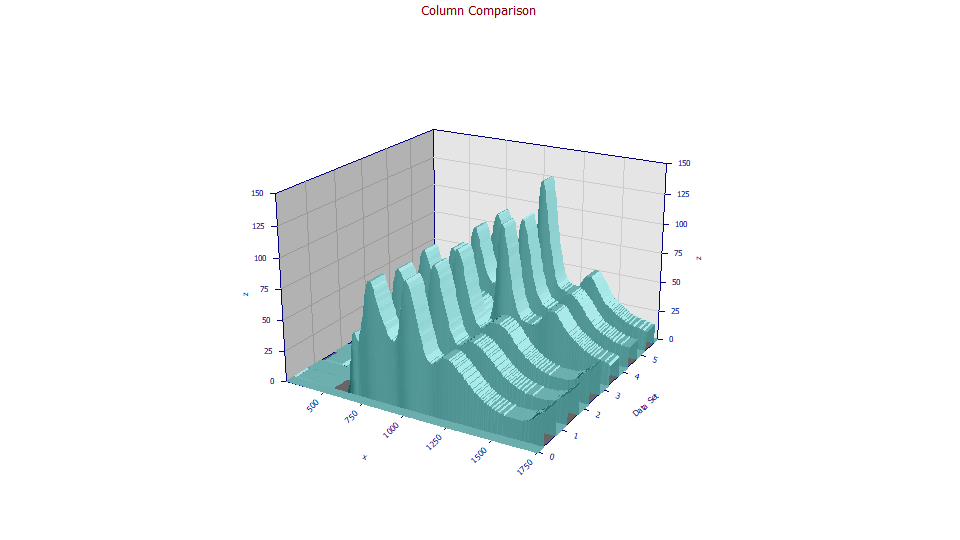
![]() The Select
Color Gradient for Surface or Contour button in the graph toolbar offers the means to modify the
surface color gradient used in the light shading. A user-defined gradient is an option. The gradient plots
options will be unavailable when the 3D Shaded format is selected.
The Select
Color Gradient for Surface or Contour button in the graph toolbar offers the means to modify the
surface color gradient used in the light shading. A user-defined gradient is an option. The gradient plots
options will be unavailable when the 3D Shaded format is selected.
![]() The Overlay Data on Surface or Contour option in the graph toolbar will show or hide the data in
the surface plot.
The Overlay Data on Surface or Contour option in the graph toolbar will show or hide the data in
the surface plot.
![]() The Toggle Legend for Surface or Contour item in the graph toolbar will display or hide the gradient
legend to the right of the plot.
The Toggle Legend for Surface or Contour item in the graph toolbar will display or hide the gradient
legend to the right of the plot.
![]() The Modify
3D Animation Settings in the graph toolbar is used to specify an animation, the settings to be
used in rotating the surface in real time in 3D space. You should adjust the angular steps to fit the
speed of your graphics card. If you have a very fast card, you may be able to set 1 degree steps for a
very smooth animation of surfaces.
The Modify
3D Animation Settings in the graph toolbar is used to specify an animation, the settings to be
used in rotating the surface in real time in 3D space. You should adjust the angular steps to fit the
speed of your graphics card. If you have a very fast card, you may be able to set 1 degree steps for a
very smooth animation of surfaces.
![]() The Start/Stop Animation button in the graph toolbar is used to begin and end the real-time animation
of the surface in 3D space. When an animation is underway, simply click on the surface to pause the animation,
and click again to restart. All options other than the Stop are disabled when an animation is underway.
The Start/Stop Animation button in the graph toolbar is used to begin and end the real-time animation
of the surface in 3D space. When an animation is underway, simply click on the surface to pause the animation,
and click again to restart. All options other than the Stop are disabled when an animation is underway.
Wheel Button Mouse Rotation
If you have a mouse with a middle button wheel, you can change 3D view angles using this wheel button. You can do this from the View and Compare Data window when 3D graphs are being rendered.
To rotate the surface by XY angle, rotate the wheel upwards to increase the XY angle, downwards to decrease the XY angle. The rotation will be in 5 degree increments. If you hold the Ctrl button down while rotating the wheel the XY rotation will be in 10 degree increments.
To rotate the surface by Z angle, hold the Shift key down and rotate the wheel upwards to increase the Z angle, downwards to decrease the Z angle. The rotation will be in 5 degree increments. If you hold the Ctrl button down while rotating the wheel the Z rotation will be in 10 degree increments.
If your wheel mouse has a tilt wheel, you can also increase the Z angle toward +90 degrees by holding the tilt button to the right and releasing it when you have the angle you wish. You can decrease the Z angle toward -90 degrees by holding the tilt button to the left until the desired angle is rendered. The rotation will be in 5 degree increments. If you hold the Ctrl button down while holding the tilt wheel left or right, the Z rotation will be in 10 degree increments.
Single Plot
The Single Plot format displays all data sets in a single 2D X-Y plot.
![]() You can also use the Display as a Single 2D Plot button in the toolbar to select this format.
You can also use the Display as a Single 2D Plot button in the toolbar to select this format.
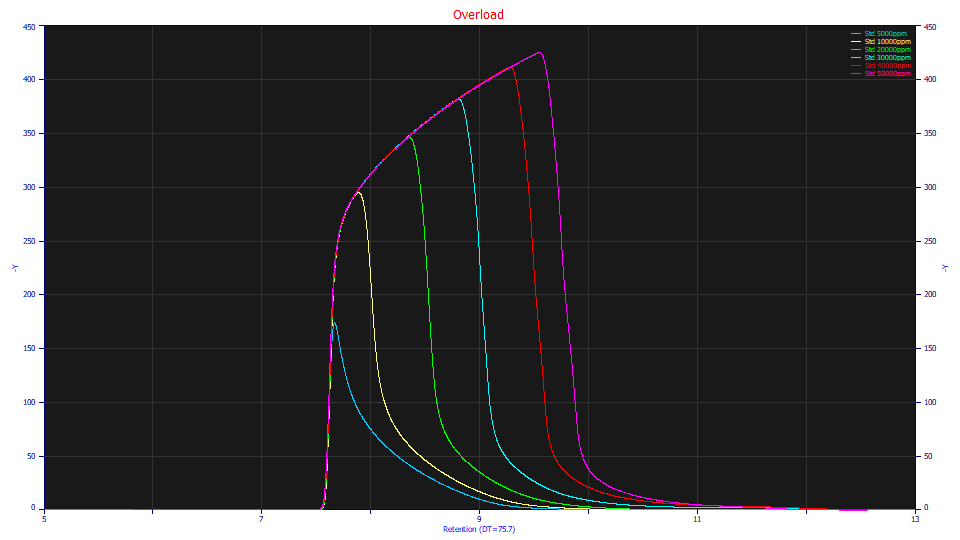
![]() The Show or Hide Legend Titles toolbar option will display or hide the titles for the different
data sets.
The Show or Hide Legend Titles toolbar option will display or hide the titles for the different
data sets.
Single/Contour
The Single/Contour format places the contour plot in the upper Y2 axis, and single plot in the lower Y axis.
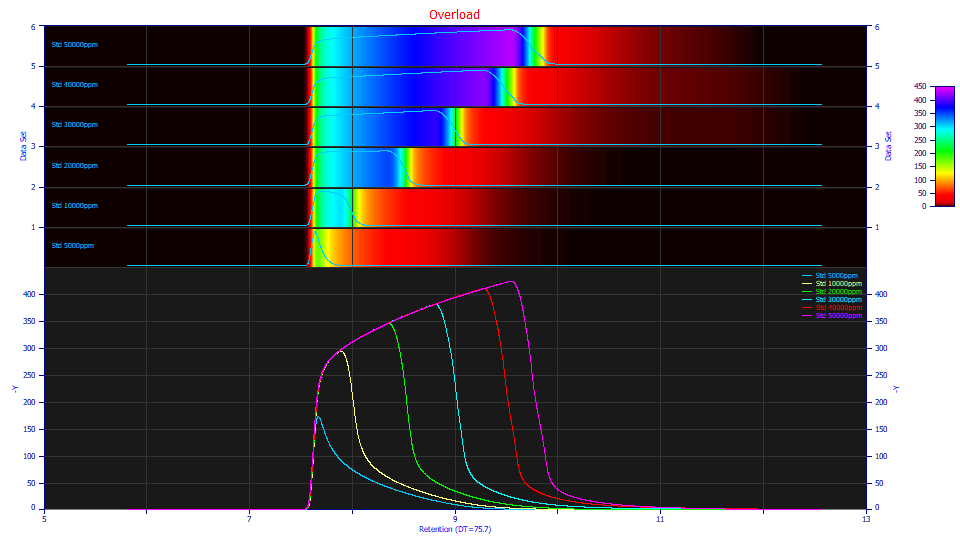
Normalizations
You can compare data directly, with no adjustment between the different data sets by using the None normalization.
If you select the Unit Area, each of the data sets will be normalized for unit area. Each data set, in its entirety, will be adjusted to have an area of 1.0.
For Unit Magnitude, each data set will be normalized for a maximum amplitude of 1.0.
The zoom-states of the data do not impact normalizations, only the scaling of the plots.
Adjustments
An option of Force Z-min=0 will prevent slightly negative values from causing the gradient to scale where it begins at a negative value. Most gradients in PeakLab have been adjusted to show a very dark color at a pure zero baseline and swiftly change color once any signal is present. To take advantage of this refinement in 3D surface rendering, you may need to check this option.
Identification
For the 2D Single Plot and the Single/Contour options, you can check the Use Mouse option to have the data set closest to the mouse highlighted and identified by its main title. You can also check the Use Legend option where you put the mouse over the legend title for the data you wish to see highlighted.
Zoom-In Comparisons
You will often wish to see only a narrow region when comparing chromatograms. The easiest way to do such comparisons is to begin with the Contour format, and zoom the retention region and data sets of interest. Note that the data sets must be contiguous. If you have six data sets, for example, you can zoom-in the contour so that sets 2-5 are included with a specific retention band and only those data sets will be plotted, and only within the band of retention in the zoom. If you proceed to change formats, this zoom will be retained. The 3D gradients and surfaces will reflect those four data sets, and only the region selected in the contour. To see all data sets, be sure to include all data sets in the Y-zoomed region.
Map Process Variable Values
If you have used the Map Experimental Process Variables option, these values will be set in parentheses and appended to the data titles in the legend.


 |