PeakLab v1 Documentation Contents AIST Software Home AIST Software Support
Search for Optimum Model

In the three AutoFit options, any single peak placement will result in this Search for Optimum Model, Single Fitted Peak... right menu option appearing.
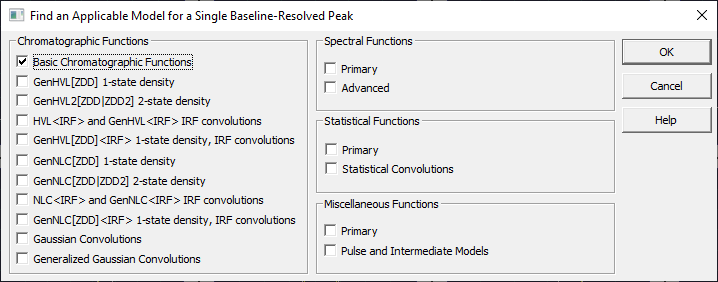
The premise is that you may have a peak, a single peak, and you wish to quickly check the program's models to see which have a capability of fitting a specific shape.
Many experimental options appear in the list. Unless you are doing extensive research in peak modeling, you will probably wish to use only a subset of the different sets of models.
Chromatography and GC
We recommend the following for the comprehensive exploration of an IRF:
Basic Chromatographic Functions
HVL<IRF> and GenHVL<IRF> convolutions
GenHVL[ZDD]<IRF> 1-state density, IRF convolutions
For exploring a model after the IRF has already been presubtracted:
Basic Chromatographic Functions
GenHVL[ZDD] 1-state density
Chromatography and LC
We recommend the following for the comprehensive exploration of an IRF:
Basic Chromatographic Functions
NLC<IRF> and GenNLC<IRF> convolutions
GenNLC[ZDD]<IRF> 1-state density, IRF convolutions
For exploring a model after the IRF has already been presubtracted:
Basic Chromatographic Functions
GenNLC[ZDD] 1-state density
Reviewing the Fits
Although we have made a good effort to have the estimates sufficient to yield the optimal fit, certain models are experimental, and have seen far less attention with respect to automatic parameter estimates. Simply because a model fails to appear well in this screen, doesn't necessarily tell the whole story. The procedure also uses the built-in estimates for ZDD and IRF parameters instead of the specific estimates set in the ZDD and IRF dialogs. This will allow an experimental peak be fitted without the additional knowledge of experimentally determined ZDD and IRF values.
The PeakLab text window will offer options to sort by goodness of fit:
Model [1-r2]ppm Fstat a0 a1 a2 a3 a4 a5
GenNLC[V] 2.87 197331221 9.5581121 6.2196746 8.64e-6 -2.32e-5 0.0204250 -35.59701
GenNLC[Y] 11.60 48796227 9.5658273 6.2394206 1.142e-5 -3.72e-6 2.1155092 -1.713143
Gen2NLC 11.60 48796227 9.5658273 6.2394010 1.142e-5 -3.72e-6 2.1155092 -1.713137
Gen2HVL 11.60 48796227 9.5658273 6.2394010 0.0119367 -3.72e-6 2.1155092 -0.003277
Gen2HVL[Lin]-udf3 11.76 48113428 9.5658251 6.2396335 0.0156118 -5.76e-6 2.1158749 -0.006995
Gen2HVL[Linm]-udf4 11.76 48113425 9.5658250 6.2394669 0.0156118 -5.75e-6 2.1158758 -0.007019
GenHVL[Linm]-udf2 27.63 25618096 9.5762449 6.2353334 0.0144819 -3.89e-5 0.0979698
GenHVL[Lin]-udf1 27.63 25618096 9.5762460 6.2330475 0.0144820 -3.89e-5 0.0979679
Gauss 260.98 5426264 9.6143815 6.2402454 0.0151749
NLC 178.98 5273526 9.6145887 6.2388626 1.844e-5 -5.24e-6
HVL 179.55 5256779 9.6146654 6.2389306 0.0151699 -9.86e-6
Giddings 270.82 5228902 9.6143294 6.2402590 1.845e-5
GenHVL 135.45 5224398 9.5928912 6.2342545 0.0144006 -4.87e-5 0.0855736
GenNLC[Z] 135.45 5224398 9.5928912 6.2336372 1.663e-5 -4.87e-5 37.042683
GenNLC 135.45 5224398 9.5928912 6.2342545 1.663e-5 -4.87e-5 37.046346
LN4 186.76 5053760 9.6149908 6.2404647 0.0357297 0.9779934
GMG 206.84 4562956 9.6183455 6.2472920 0.0141891 -0.009047
EMG 232.33 4062319 9.6207411 6.2440530 0.0147026 -0.003925
RHVL 179.53 3941504 9.6125544 6.2389320 0.0151707 -9.85e-6 1e-12
GenNLC[T] 177.94 3180197 9.6115236 6.2387149 1.843e-5 -1.16e-5 1e+6 2.0100162
If a fit failed significance in one or more parameters, it will be shown in gray and the offending parameter(s) will also be grayed. If user-defined peaks are present, they will also be fitted.
In this test of a single gradient HPLC peak, the GenNLC[V] model had the best F-stat and lowest unaccounted variance.
As an alternative to this quick fit test for an optimum model, a much more extensive Model Experiment can be done.


 |