PeakLab v1 Documentation Contents AIST Software Home AIST Software Support
Confidence and Prediction Intervals
Confidence Intervals
The Review peak fit graph offers the option of displaying confidence and/or prediction bands about the fitted curve.
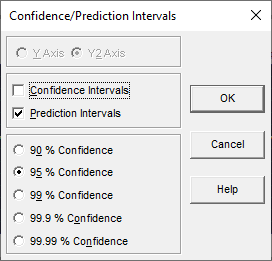
![]() The Set Confidence/Prediction Intervals, % Confidence button is used to set confidence interval
type and percentage. The option opens a simple dialog where you can individually check Confidence Intervals
and Prediction Intervals, and where you can select a % Confidence.
The Set Confidence/Prediction Intervals, % Confidence button is used to set confidence interval
type and percentage. The option opens a simple dialog where you can individually check Confidence Intervals
and Prediction Intervals, and where you can select a % Confidence.

![]() The Show Confidence/Prediction Intervals button toggles the currently set intervals on and off.
The Show Confidence/Prediction Intervals button toggles the currently set intervals on and off.
The selected confidence level applies not only to the confidence and prediction intervals in the graph, but also to confidence limits on the parameters in the Numeric Summary, and to the confidence and prediction ranges for the data in the Data Summary.
Confidence Intervals
Confidence intervals are useful for replicated data where, for each X, you have either multiple Y observations or a single Y value which represents an average from multiple Y observations (when each Y value in the data set consists of an average from multiple observations at the same X, the point should be weighted with the inverse square of the standard deviation). With many Y observations at a given X, the average Y can be said to approach the true Y value, since the errors will sum to zero.
A 95% confidence interval is the Y-range for a given X that has a 95% probability for containing the true Y value.
A confidence interval cannot be used to predict, for a given X, where the next individual observation of Y will occur.
Prediction Intervals
Prediction intervals are useful for predicting, for a given X, the Y value of the next experiment. It is often used when a fit represents a single experiment, where each Y value is a single observation rather than an average. In this case, the weight for each Y value isn't based upon a standard deviation from multiple observations, but rather is inversely related to the experimental uncertainty for the individual measurement, if such is known. If the uncertainty of the Y measurement is unknown or thought to be equal for all X, all points can use equal 1.0 weights.
A 95% prediction interval is the Y range for a given X where there is a 95% probability that the next experiment's Y value will occur, based upon the fit of the present experiment's data.
Local Measure of Error
Confidence and prediction intervals measure the confidence only at a specific X, not for the entire X data region. These must be computed for each X value in the curve. For fits containing many peaks or peaks that are computationally intensive, it may take some time to compute these intervals.
Relation to Standard Error
There is often a strong similarity between points which lay outside 2 standard errors and the 95% prediction interval. These are not identical, however.
The standard error of fit is based upon the overall fit. It matters not if a point is near a portion of the curve well characterized by the fit, or one only poorly so. A certain standard error in Y exists for the overall fit, and a point with a residual whose magnitude lay beyond a given multiple of this value is drawn in a certain color.
The prediction interval, on the other hand, is a more localized measure of error. Points near a region of the curve strongly determined by the fit will have a slightly tighter confidence interval than those points near a region of the curve only weakly determined in the fit. Generally, strongly determined regions will have a good number of accurate data points whereas poorly determined regions will have few points with considerable variability. With peak-type data, confidence and prediction intervals are often narrowest near the centers of the various peaks and wider furthest from these centers.


 |