PeakLab v1 Documentation Contents AIST Software Home AIST Software Support
Graph View 3D
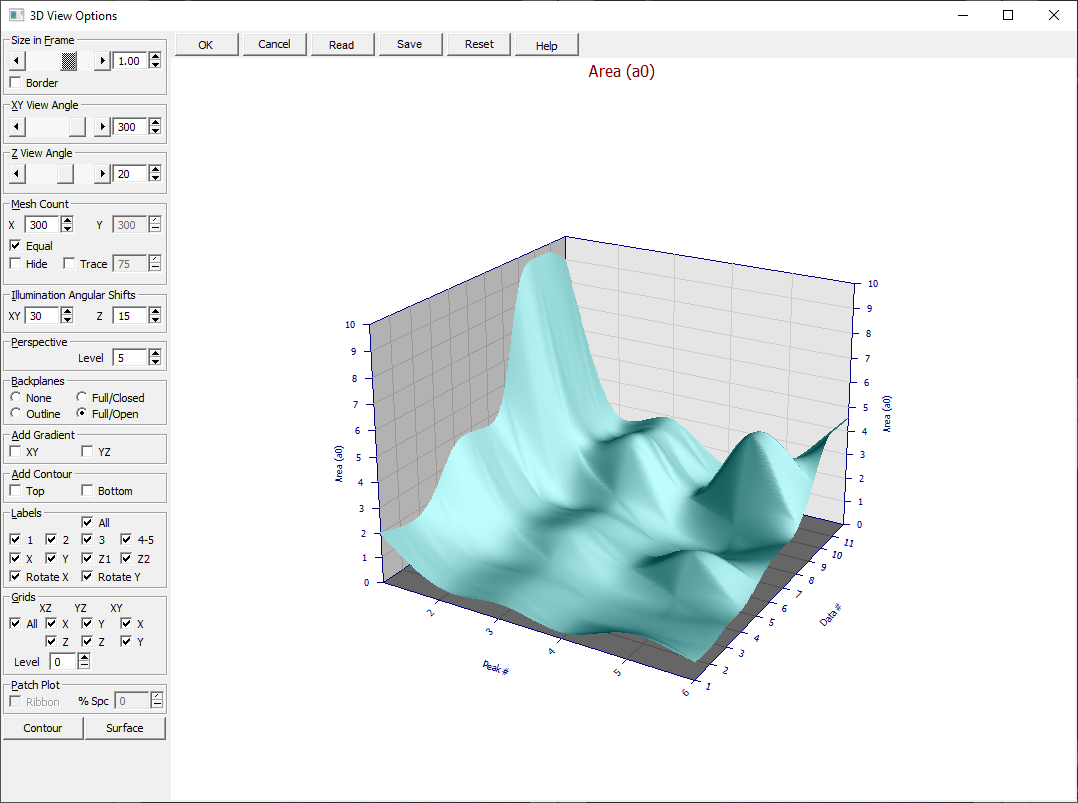
![]() on a 3D graph, the Modify Graph View toolbar button opens the following dialog to to change the
main 3D settings.
on a 3D graph, the Modify Graph View toolbar button opens the following dialog to to change the
main 3D settings.
![]() Use the Select
Color Gradient for Surface toolbar button to change the gradient used in the 3D surface
plots.
Use the Select
Color Gradient for Surface toolbar button to change the gradient used in the 3D surface
plots.

The 3D View dialog contains a separate plot which will reflect all changes made in the view. If multiple graphs are present, this dialog will show only the first of the graphs. The type of plot and display may change in accord with the option being modified. After a couple of seconds of inactivity, the plot will be updated to reflect all options currently selected.
Size in Frame
The Size in Frame scrollbar controls the size of the graph in the frame. You can also set the size in frame using the edit field to the right, the spin buttons, or right click the edit field and select the size from a menu. The minimum is 0.5 and the maximum is 1.25. To preserve a length reference for fitted points and residuals, graphs are not rescaled in the frame to account for the additional space often required for large Z view angles. When such high Z view angles are used, the graph size can be reduced using this option.
The Border checkbox, if unchecked, will disable the rendering of the border around the frame of the graph.
View Angles
The scroll bars control the XY View Angle and the Z View Angle. You can also set the angles using the edit fields to the right, the spin buttons, or right click the edit field and select the angle from a menu. The graph will update as the angles are changed. The Z view angle can be varied from 90 to -90 degrees while the XY view angle can be varied from 0 to 360 degrees. The default Z angle is 20 degrees and the default XY angle is 300 degrees. This fourth quadrant position has X increasing left to right, and Y increasing into the view. The easiest way to picture view angles is to imagine the surface and data being fixed in space and that you, as the viewer, freely move about a large boom that extends a significant distance from the surface. The view angles are then formed by this imaginary boom and its relation to the XY plane.
Mesh Count
The X and Y mesh counts are set using the edit field and its spin buttons. Here as well you can right click the edit fields and select the mesh counts from a menu. The maximum mesh supported is 500x500. Check the Equal box to have have the X and Y equal and set from a single entry field.
For a shaded surface, the higher the grid spacing, the more detailed and smooth the surface. The default for a shaded plot is 300x300 mesh. A much faster rendering can be realized by reducing this high-resolution grid. In a shaded surface, mesh elements are not highlighted (drawn with a separate border color).
For a gradient surface, the default is 120x120 mesh. This should furnish about the optimum mesh highlighting. By default, the mesh highlight will be a uniform gray color. The Hide option will fully remove this mesh border.
The Trace option will create a variable color border that traces the mesh boundaries with colors that are slightly shifted within the gradient, just enough to softly highlight the mesh. If you select the Trace option, you must also set the transparency of the trace. A value of 10% will produce a very strong mesh highlight. A value of 90% will be very nearly invisible. The default is 75%.
Illumination Angular Shifts
The XY illumination angular shift and Z Illumination angular shift options apply only to shaded plots. The light source illuminating the surface is specified relative to the viewer. Again, if you imagine the surface and data being fixed in space and that you, as the viewer, freely move about a large boom that extends a significant distance from the surface, the illumination angular shifts reflect the degree to which this source is shifted from this boom. The default shifts of 30 degrees XY and 15 degrees Z are similar to what you might find holding a flashlight to your right side, above your head, and pointed at the surface. Note that surfaces are considered transparent in PeakLab shaded plots. This means that light can reach a surface element from behind as well as through other elements. Right clicking the spin button or edit field will offer a menu of available angular shifts.
Perspective
Ten different levels of Perspective are available from 1 to 10. A value of 0 removes all perspective. The default is 5. With perspective, a fixed area of the surface will appear larger in the front and smaller in the rear portion of the plot. For a properly rendered contour (a 90 degree Z view angle), the perspective must be zero.
Backplanes
There are four Backplanes options. The None option does not draw any kind of XY, YZ, or XZ plane in the graph. The Outline option will draw the three backplanes, but will not fill them with color. The Full/Open and Full/Closed options draw the three backplanes and fill them with the colors specified for these planes. The foreground of the box is not drawn in the Full/Open option. To change these colors, use the 3D Graph Colors option in the main graph and choose the 3D Graph Customize Colors button.
Add Contour
There are two Add Contour options. The Top option draws a contour plot in the XY plane at Zmax and the Bottom option will draw a contour plot in the XY plane at Zmin. You may have both drawn if you wish. The type of contour plot drawn will depend on the type of graph currently selected. Gradient and shaded plots will have a gradient contour, the colors and their count matching those in the main graph. The standard mesh plot will have the standard line contour with a filled background while the contour for the wire plot will consist only of the contour lines.
Labels
You have full control of the Labels that are drawn in the graph. The All selection turns on and off all of the individual labels. You may individually control the display of the titles 1, 2, 3, 4-5, and the display of the axis labels X, Y, Z1, Z2. You may choose to have horizontal X and Y labels or these can be rotated with the Rotate X and Rotate Y options.
Grids
You also have full control of the Grids that are drawn in the graph. The All selection turns on and off all of the individual grids. You may individually control the grids in the XZ plane X, Z, in the YZ plane Y, Z, and in the XY plane X, Y. The density of the grid is controlled with the Level option. A level of 0 draws a simple line. A level of 1 alternates drawing a dot at every other position along the line. A level of 2 draws one dot for every 2 empty spaces. The highest level of space is 10. For certain export options which do not allow this type of grid, a dotted line will be used.
Patch Plot
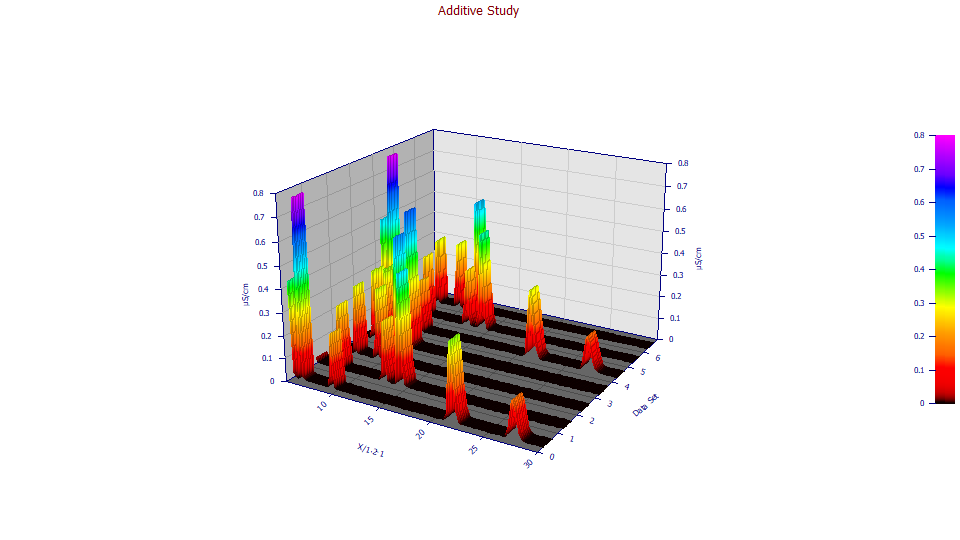
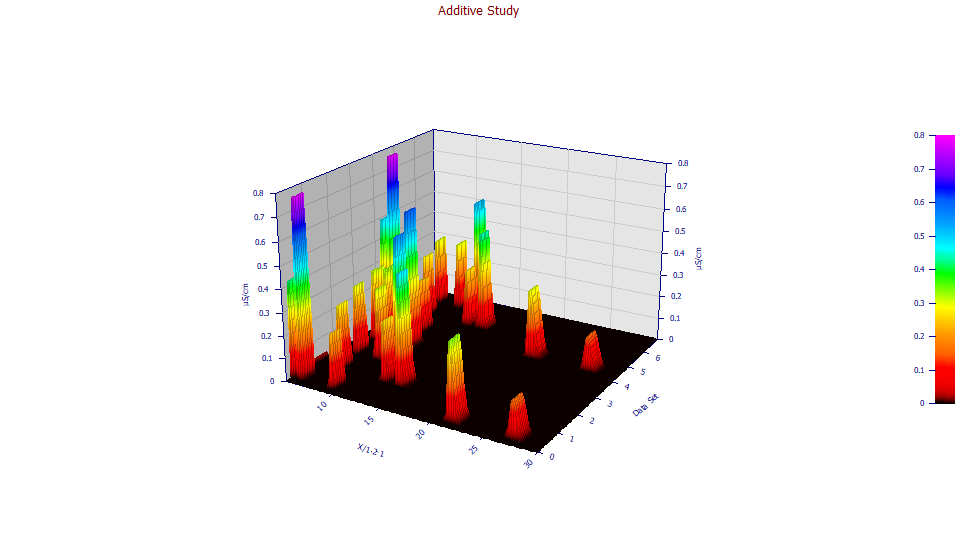
When the Y variable is a data set instead of a continuous Y values, a "patch" plot may be rendered. A patch plot renders much more quickly. The Ribbon option fills only the upper surface of and leaves the Y sides of the surface open and unfilled. The % Spc sets the percentage of space between the data sets. The % Spc can vary from 0 to 90%. The default is 50%. When Ribbon is checked, the surface is open in the Y dimension, and when unchecked, the surface is filled:


Contour
To immediately modify all of the settings to produce a default 3D-graph contour (90 degree Z angle view), click the Contour button. This will be a contour plot drawn by the specific settings in the 3D surface rendering engine. A separate contour plot, using the 2D graph rendering engine, is used for most of the program's contour plots.
Surface
To immediately modify all of the settings to produce a default Surface, click the Surface button.
Restoring Defaults
The Reset button restores the program's 3D View defaults for the current graph.
Saving and Reading View Configurations
You can Save the current view configuration to disk. While the program automatically saves the current view configuration for each of the program's graphs across sessions, you will need to save a view if you wish to have more than one view readily available for a specific type of graph. Files are saved in binary with V3D extensions. To read a previously saved 3D view configuration, use the Read option.
Wheel Button Mouse Rotation
If you have a mouse with a middle button wheel, you can change view angles using this wheel button. You can do this in any 3D graph window without using this separate Graph View 3D dialog. You can also use the mouse within this option to adjust the view angles in the dialog.
To rotate the surface by XY angle, rotate the wheel upwards to increase the XY angle, downwards to decrease the XY angle. The rotation will be in 5 degree increments. If you hold the Ctrl button down while rotating the wheel the rotation will be in 10 degree increments.
To rotate the surface by Z angle, hold the Shift key down and rotate the wheel upwards to increase the Z angle, downwards to decrease the Z angle. The rotation will be in 5 degree increments. If you hold the Ctrl button down while rotating the wheel the rotation will be in 10 degree increments.
If your wheel mouse has a tilt wheel, you can also increase the Z angle toward +90 degrees by holding the tilt button to the right and releasing it when you have the angle you wish. You can decrease the Z angle toward -90 degrees by holding the tilt button to the left until the desired angle is rendered. The rotation will be in 5 degree increments. If you hold the Ctrl button down while holding the tilt left or right, the rotation will be in 10 degree increments.
When multiple graphs are present, the first graph is rotated and the others asynchronously adopt the same angles. You may need to pause for a few seconds to allow all of the graphs to catch up. When using the mouse, the first graph will always reflect the state of the angles and you should look at that one to affirm the view you wish to use. Certain of the other graphs may not catch up until the adjustments are completely finished. In PeakLab, all 3D graphs in a multiple graph procedure share the same view.


 |