PeakLab v1 Documentation Contents AIST Software Home AIST Software Support
Graph Point Format
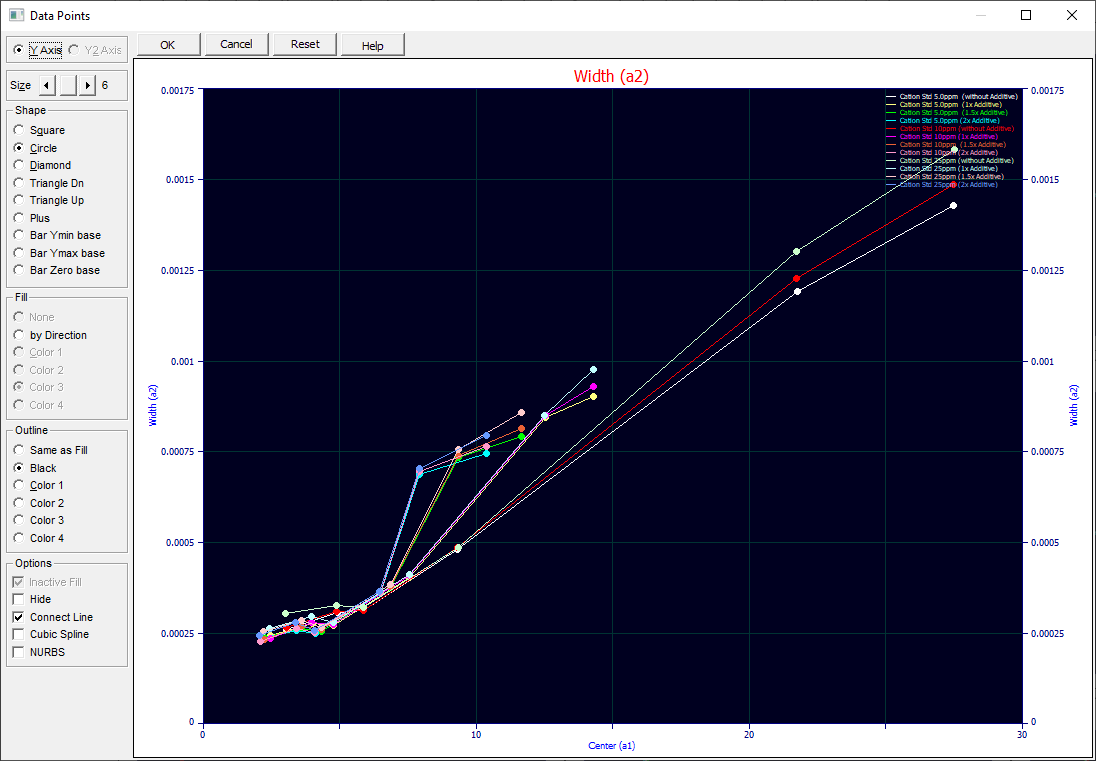
![]() For 2D graphs, the Modify point format in a PeakLab
Graph is used to control the rendering of data points. The Data Points dialog incorporates a copy
of the current graph. If multiple graphs are present, only the first graph is shown. Changes made in any
of the point format options are immediately reflected in the graph.
For 2D graphs, the Modify point format in a PeakLab
Graph is used to control the rendering of data points. The Data Points dialog incorporates a copy
of the current graph. If multiple graphs are present, only the first graph is shown. Changes made in any
of the point format options are immediately reflected in the graph.
The entry fields serve either the Y or Y2 axis, depending on whether Y Axis or Y2 Axis is selected. The Y2 options will not be available if the graph contains a single plot. This option sets only the principal data points of each Y axis. Reference data sets, if present, use a preset format.

Size
A graph's data point size may be set from zero to ten. Size 0 points are always pixels (non-bar shapes) or lines (bar shapes), regardless of the device. If the graph specifies a bar shape, this option affects the width of the bar.
Shape
A graph's points may be set as square, circle, diamond, triangle down, triangle up, or plus symbols. You may also choose a bar graph where the bar's base is zero, or the Ymin or Ymax of the plot.
Fill
You may choose to leave the points unfilled or fill them with one of the four point colors within PeakLab.
For Review Graphs, you may also choose Color by Residuals. Here the points are colored based upon the absolute value of the number of standard errors from the Y-predicted value. The default color schemes employ a coloring based upon ascending wavelength. Points less than 1 standard error are shown in blue, those between 1 and 2 standard errors are green, those between 2 and 3 standard errors are yellow, and those beyond three standard errors are red. Points that are beyond 2 standard errors may represent outliers which may be adversely impacting the overall peak fit.
Outline
To make points easier to see, you can choose an outline for the points. You can have the outline match the fill color (no outline occurs), you can select a black outline, or you can choose a different color from the Fill to furnish the contrast.
Options
· You may elect to have inactive points filled or unfilled.
· Points may be hidden entirely.
· A graph's points may be connected with simple lines.
· A graph's points may be connected with a cubic spline.
· A graph's points may be connected with a NURBS (non-uniform rational B-spline).


 |