PeakLab v2 Documentation Contents R2N Software Home R2N Software Support
Separate Compounds using MCR-ALS
The MCR-ALS algorithm is found in the ChromSpec menu's Separate Compounds using MCR-ALS. You must first import spectra for this procedure to be available.
Multivariate Curve Resolution (MCR-ALS)
MCR-ALS (Multivariate Curve Resolution - Alternating Least Squares) is an advanced chemometric technique used to mathematically resolve severely coeluting peaks in 3D spectrochromatographic data (DAD/PDA). Unlike standard non-linear peak fitting which models specific or total wavelength chromatograms, MCR-ALS is a matrix decomposition method that simultaneously resolves both the chromatographic profiles and the underlying pure spectra of overlapping compounds.
The Mathematical Foundation
At its core, MCR relies on the fundamental principle that the absorbance of a mixture is the linear sum of the absorbances of its pure components. The algorithm solves the classic bilinear matrix equation:
D = CS^T + E
Where:
D (Data Matrix): Your measured 3D dataset (Retention Time x Wavelength).
C (Concentration Matrix): The pure, resolved chromatographic elution profiles for each component.
S^T (Spectral Matrix): The pure, resolved spectra for each of those corresponding components.
E (Error Matrix): The unmodeled variance, consisting of baseline drift and instrumental noise.
How the "Alternating" Least Squares Works
The algorithm begins with an initial mathematical "guess" or seed (such as an estimated spectra for a hidden component). Because it is impossible to solve for both C and S simultaneously, the algorithm utilizes an alternating loop:
Assuming the Spectra (S) are correct, it performs a least-squares regression to calculate the Concentrations (C).
Assuming those new Concentrations (C) are correct, it performs a least-squares regression to calculate the Spectra (S).
This alternating seesaw continues iteratively until the error matrix (E) is minimized and the system converges on a stable solution.
PeakLab's MCR-ALS
Spectrum for MCR-ALS Fitting
Select the Spectra you wish to model from the dropdown. Only raw spectra are possible for selection. The D1(WL) and D2(time) data that are automatically created when DAD/PDA spectral data are imported will not be available in this option.
Start and Ending Times, Start and Ending Wavelengths
Use these fields to bracket the fitting problem. The obvious use to is remove the dead time spike from the modeling problem as well as the times and wavelengths where only noise is present.
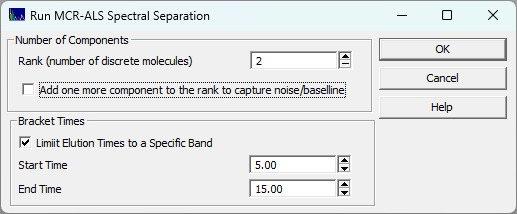
Rank
Specify one rank for each molecule in the analyte where you would expect a distinct UV-VIS spectrum to exist. If you have noise and/or baseline in the data, you may need to add one to the rank, else that will be wrapped into one of the estimated components.
PCA Rank
This applies an SVD noise pre-processing filter to the matrix prior to MCR-ALS fitting. This may allow you to omit an additional rank position for the noise in your data if you have not already used the Filter DAD/PDA Baseline option prior to initiating the MCR-ALS algorithm.
Note that the MCR-ALS will generally not respond favorably to artifacts in filtering and those will be
reflected in the rotational ambiguity. Further, it is not a simple matter of setting a matching rank for
the principal component filter (a harmonic or anharmonic waveform requires two eigenmodes to fully capture
a single signal component, not one). The eigenfiltering is also a true DSP filter and reconstruction,
and the eigenmodes which equate to the variance of principal components may not align well with your count
of MCR-ALS components. We also note that instruments often have an intrinsic detector DSP noise filter
that adds autocorrelation and produces a sloped singular value floor that makes this PCA rank estimation
far from straightforward.
If this is set to 0, no eigendecomposition pre-filtering will occur.
We have seen MCR-ALS algorithms where a PCA filter is built-in, and of the same rank, automatically
applied to suppress noise. Simply be aware that this may also distort some portion of the signal. We recommend
that that you first try the MCR-ALS fitting without any form of prefilter. You will then have a reference
point for zero prefiltering. The Filter
DAD/PDA Baseline option fits each WL's chromatogram to a Whittaker
baseline algorithm. This represents an automated form of your doing a baseline correction for the
chromatography at every wavelength in the DAD/PDA. That would be our first choice for a meaningful baseline
correction of each WL's chromatography.
Uninformed (Automatic) Modeling
The Self-Modeling Curve Resolution (SMCR) - uninformed mode - Apex Hunt is an automated routine that will attempt to thread the needle with respect to this rotational ambiguity. While this will often fare reasonably well. we again advise against using this method for quantitative analyses. In the example that we will illustrate below, we successfully used this uninformed SMCR, but we assisted the algorithm by adding a constraint to minimize rotational ambiguity distortions.
The Self-Modeling Curve Resolution (SMCR) - uninformed mode - SVD Orthogonality is similar in that it offers a fully automated fitting, but here the seeds come from an SVD partitioning. It is more computationally demanding, but it may offer more accurate starting seeds.
At the outset we will caution you that this 'uninformed' approach is not wisely used for quantification
unless constraints are used or you have confirmed the absence of rotational ambiguity on your specific
fitting problem. In our work, we have experimentally generated hundreds of different seed combinations
in a complex MCR-ALS analysis and the result, without additional constraints, was hundreds of distinct
renderings of the chromatography and spectroscopy, no two alike. Rotational ambiguity is not like a nonlinear
fitting problem where the optimization can land in some finite count of local minima, each of which represent
an non-optimal (non-global) solution. In MCR-ALS the minimum surface can be a flat floor with an infinite
number of solutions where constraints are essential to estimate the specific n-dimensional position upon
that flat minimum surface.
Since the purpose of this algorithm is to separate overlapping or hidden peaks using the full 3D chromatographic
spectra from the DAD/PDA of a UHPLC instrument, this generally means there will not be a specific peak
in the chromatographic data consisting exclusively of the UV-VIS spectrum for that component. In such
a case, the "uninformed" or automated MCR-ALS may be your only option if you have not identified
the count and chemistry of the compounds or you lack the pure compounds for making separate chromatographic
runs.
One exception are isomers which are from a single compound which uses one rank position in the modeling problem. One or more of a set of isomer peaks may singularly elute in time. When that is present you can do an informed modeling using the times for each compound where a discrete baseline resolved isomer exists.
When dealing with one peak per rank in the modeling, you will generally be dealing with a feature with
a significant overlap, or a hidden peak that is buried in the left or right shoulder of a larger peak.
In that case, the ideal starting spectra will generally be the spectra derived from the leading and trailing
edges of an overlapped pair, provided the elution is such that those edges consist of just one component.
When that is possible, you will likely have a greater success specifying the times of these edges as part
of an informed modeling.
When you simply do not know the how many compounds are present in the bracketed problem, what those
compounds are, and whether any of the elutions are pure, you may be able to discern changes in spectra
across a peak using the View
DAD/PDA 3D Matrix option or inspecting the maximum WL map offered in the DAD
3D Chromatography option. In our experience, you may be able to select a better estimated rank and
seed times using your own human judgment than any of the existing MCR-ALS automated uninformed procedures.
Note that while you can run the fully automated option PeakFit offers, you can also use the Informed
mode and have the seeds initially populated with estimates from the Apex Hunt and SIMPLISMA
methods. You can then inspect these times in the spectra using the View
DAD/PDA 3D Matrix option. You can see this as an uninformed approach with a human override. These
procedures locate extracts at times where orthogonality or some other property of differentiation is selected
for the algorithm's starting point.
Informed (Human Judgment) Modeling
The Knowledge-based MCR-ALS - informed mode can be used for quantitative analysis, but it works
best if you have identified the coeluting compounds that you wish to quantify. When you select this option,
you must specify the Seed Spectra. In PeakLab's MCR-ALS implementation, these must also be PDA
spectra of the pure compounds from either a separate standards run or identified regions of the target
spectrum where you have determined compound-specific spectra elute.
In our experience, fully-informed MCR-ALS where the seeds consist of pre standards run separately
on the same instrument, are capable of surprisingly accurate separations. You can use the All Except
Target to populate the n rank Seed Spectra fields. If you click the Maxima button, the Time
fields will be populated with the apex location of the maximum amplitude peak in the spectrum. If you
click the TAC button, this will set all of the Time fields to 0. When the Time is set to
0, PeakLab will compute the TAC (total absorbance chromatogram - the all wavelength chromatogram) and
that will be used as the seed.
You can also specify the Time where the spectra will be taken from the source you have selected for each rank position. For especially difficult problems where you must extract the spectra from the target spectrum. you can populate the Time fields with the estimates from the Apex Hunt or SIMPLISMA method. We can recommend first inspecting spectra using zoomed regions in the View DAD/PDA 3D Matrix option before initiating an MCR-ALS fit when you must draw your starting seeds from the matrix selected for the fitting. You should override the times that these different algorithms suggest if you know about where the best seeds will be found in time.
Constraints - Overcoming Rotational Ambiguity
A primary weakness of raw MCR is "rotational ambiguity"—the fact that a single matrix can have an infinite number of mathematically valid, but chemically impossible, solutions (such as predicting negative concentrations). To force the algorithm to find the true chemical reality, the PeakLab MCR-ALS implementation relies on constraints, some of which are user selectable:
1. Non-Negative Least Squares (NNLS) Constraints:
PeakLab enforces strict non-negativity on both the Concentration (C) and Spectral (S) matrices during every iteration. This guarantees that the algorithm will never attempt to resolve a compound with a negative absorbance or a negative concentration.
2. Dynamic Gaussian Seeding:
Rather than relying on random noise or the purest variables to start the calculation, PeakLab intelligently seeds the initial concentration matrix using targeted Gaussian estimations. This gives the optimizer a massive head start and prevents the algorithm from collapsing into local mathematical minima.
3. The Normalization Constraint (Solving Scale Ambiguity)
Because MCR-ALS factors the experimental data into two separate components (concentration and spectra),
it suffers from "scale ambiguity." Without constraints, the algorithm can arbitrarily inflate
the Y-axis of the chromatogram while proportionally shrinking the Y-axis of the spectrum, all while maintaining
a mathematically perfect fit. To ensure your resolved peaks have quantitative meaning, PeakLab automatically
applies a normalization constraint to the spectral matrix. This locks the maximum absorbance of every
resolved spectrum to exactly 1.0. Because the spectral scale is fixed, the resolved chromatograms are
forced to carry the exact quantitative magnitude (absorbance units) and area of your original experimental
data.
Note that this normalization also forces the chromatographic area to represent the total absorbance
across the bracketed window. This explains why the resolved peak heights and areas generally exceed single-wavelength
raw data.
4. Targeted Time and Wavelength Windowing (user-adjustable):
Because MCR-ALS looks at the global variance of the entire matrix, distant peaks and shifting baselines can easily confuse the optimizer. PeakLab allows you to specify strict Start and End time cutoffs. By isolating a specific coeluting cluster, the algorithm is forced to focus its entire resolving power exclusively on the local overlap.
5. Unimodality Constraint (user-selectable)
The Unimodal constraint (enforce single peak per component) checkbox will force the algorithm to generate one peak for each rank in the fitting problem. Each component will be a single peak as opposed to multiple separate or overlapped peaks. If you are fitting isomers where there will be multiple peaks for each rank in the fitting problem, you must not use this constraint.
6. Purity Constraint (user-selectable)
The Purity constraint (enforce single component peaks when the data support such) checkbox will analyze complex separations and if the rotational ambiguity introduces a kind of crosstalk or leakage across components, a single compound will be assigned to each applicable peak.
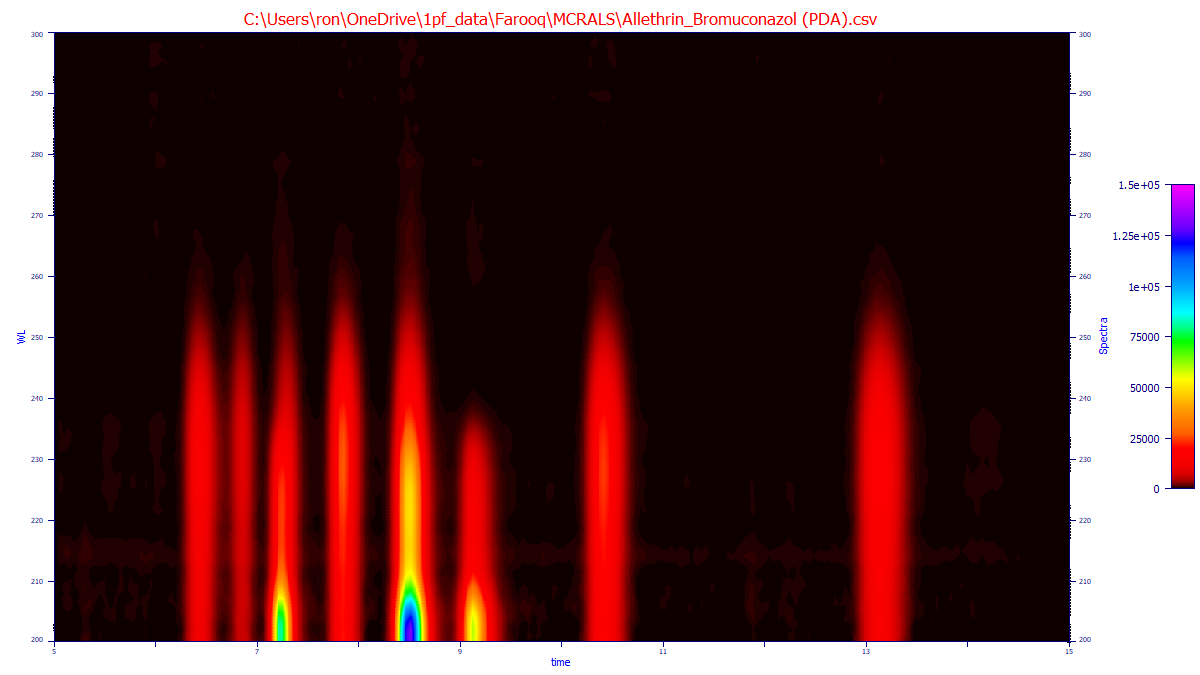
Example - "Uninformed" Analysis
This is the 3D spectral matrix data of a mix of allethrin and bromuconazol. Allethrin has eight stereoisomers. the first two coeluting in the chiral separation, seven peaks total. Bromuconazol has four stereoisomers, three resolved in the chromatography. Eight peaks are visible the mixture. The following MCR-ALS analysis uses a rank of 2 (two compounds) and a purity constraint to address rotational ambiguity. This purity constraint seeks to identify compounds that would appear singular, but where a measure of the second component appears from this mathematical rotational ambiguity effect often referred to as 'leakage'. An uninformed analysis is one where there are no separate chromatographic analyses of analytical standards and no times in the chromatogram of the mixture where each of the components individual exist, or if those exist, those are not used for the computations.
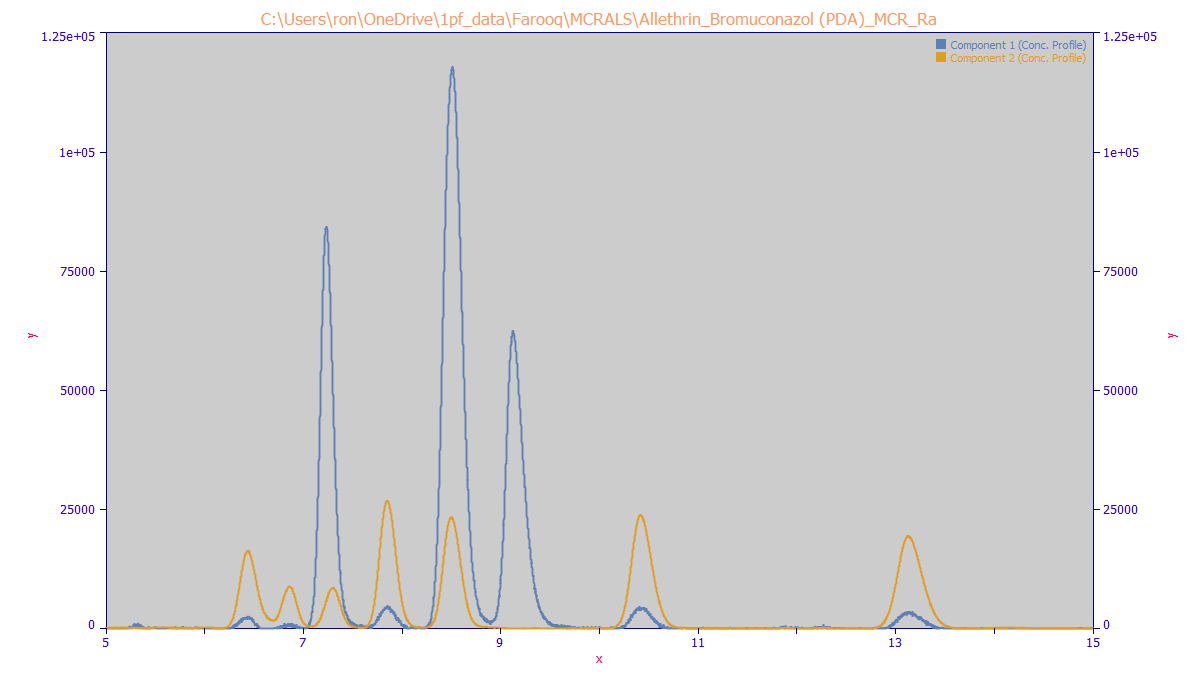
The MCR-ALS algorithm produces the following chromatographic separation of the two components. The allethrin is in white, the bromuconazol in yellow:
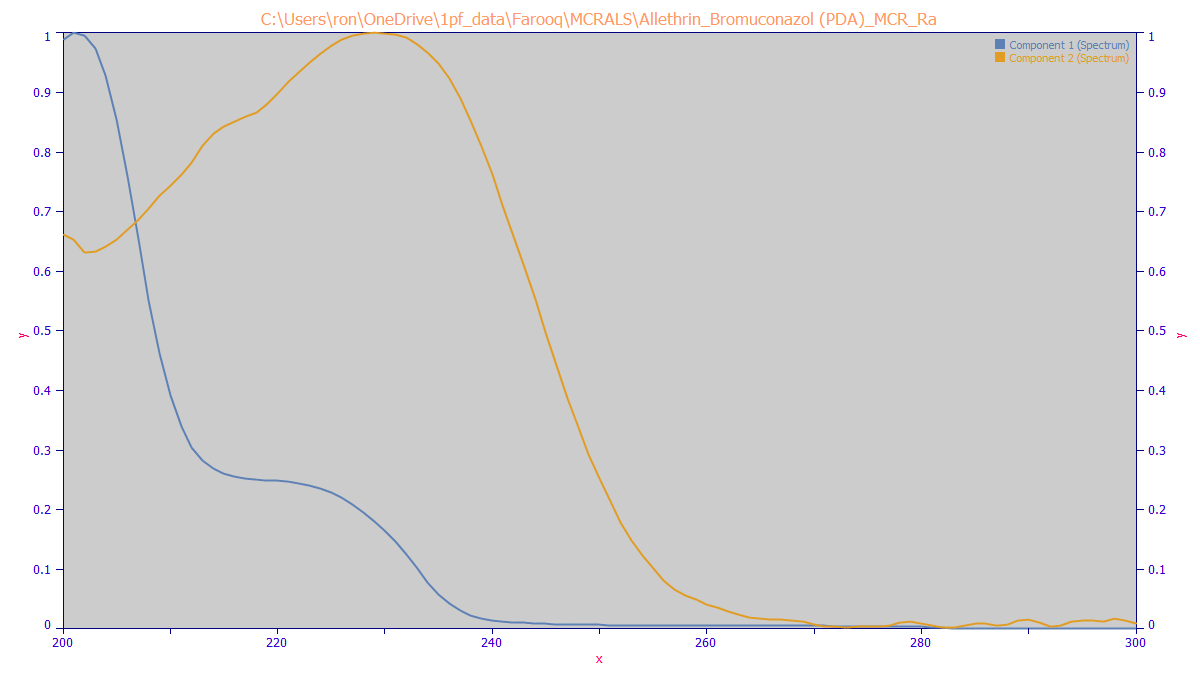
The MCR-ALS algorithm estimates the following spectra for the two components:
Example - "Informed" Analysis
This is where MCR-ALS can absolutely amaze. You help the algorithm by giving it starting estimates for the spectra of the individual components. In effect, your chemistry knowledge is infused into the algorithm. There are two ways this can be done.
Fully Informed
You can run the known compounds as standards. For PeakLab, you will have to specify these as additional 3D chromatographic spectra. This allows the starting spectra to have to change very little to realize the MCR-ALS solution. This can be seen as a "fully informed" analysis, but it requires you to identify the compounds, secure high purity standards, and run them. There are a few buttons for convenience. The All Except Target will populate the first n (rank) of loaded spectra that are not the selected spectra as seeds. This will automatically find the maxima in the spectra. If you select the spectra manually, you can use the Maxima button to find the times in these spectra. The TAC button (Total Absorbance Chromatogram) will compute the spectra at all times and wavelengths in the modeling problem. This is realized by setting the times to 0.
Partially Informed
Here you must specify the spectra of the different components from the locations of the peaks in the analysis data where you believe one of the components is exclusively or predominantly present. There are no separate standards, no component identification, and no separate runs of the chromatography Instead, you help the algorithm by giving it the times in the chromatography where your believe the discrete molecules are fully or mostly present. You can also use certain algorithms which will attempt to find these seeds for you automatically. There is the Apex Hunt, the SIMPLISMA, and the Orthogonal methods.
The Test Data
To create an especially challenging test, we began with the independent 3D spectra of the three principal
curcuminoids: curcumin (C), demethoxycurcumin (DMC), and bis-demethoxycurcumin (BDMC). These were acquired
from separate isocratic chromatographic runs of these standards. To be able to test the recovery of the
higher moments of the different peaks using MCR-ALS, we blended the three spectra mathematically, in equal
amounts. and arrayed so that the broadest peak, the latest eluting C, was centered, and the intermediate
eluting DMC was shifted n dx time units to the left, and the first eluting and narrowest BDMC was shifted
an equal count of n dx time units to the right.
At very high coelutions, this means that even the leading and trailing edges of the chromatographic
feature (which appears to be a single peak) would be a muddle where no pure spectra were available at
these edges. This would seriously challenge the various "uninformed" MCR-ALS methods to find
three appropriate seeds where the algorithm would iterate from a condition of extreme muddle in all three
starting spectra, to the correct solution - without knowing in advance the true spectra of the discrete
compounds.
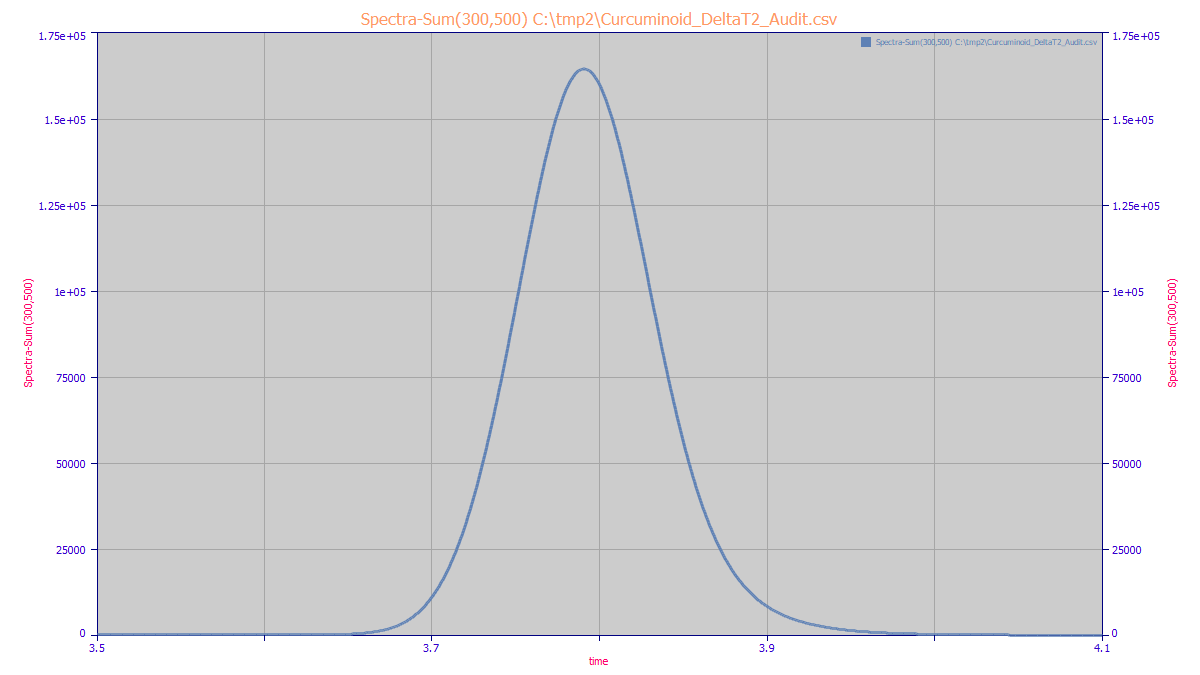
For this example, we will exactly align the three chromatographic peaks using the C as a reference
and introduce a +/- 2 time unit shift in the data for the DMC and BDMC. This equates to a 0.8 second shift
earlier in time for the DMC and a 0.8 second shift later in the time for the BDMC for a peak that has
a full width (10% amplitude) of 11.4 sec. This is what the composite or blended chromatographic feature
look like in a 300-500nm total absorbance chromatogram.
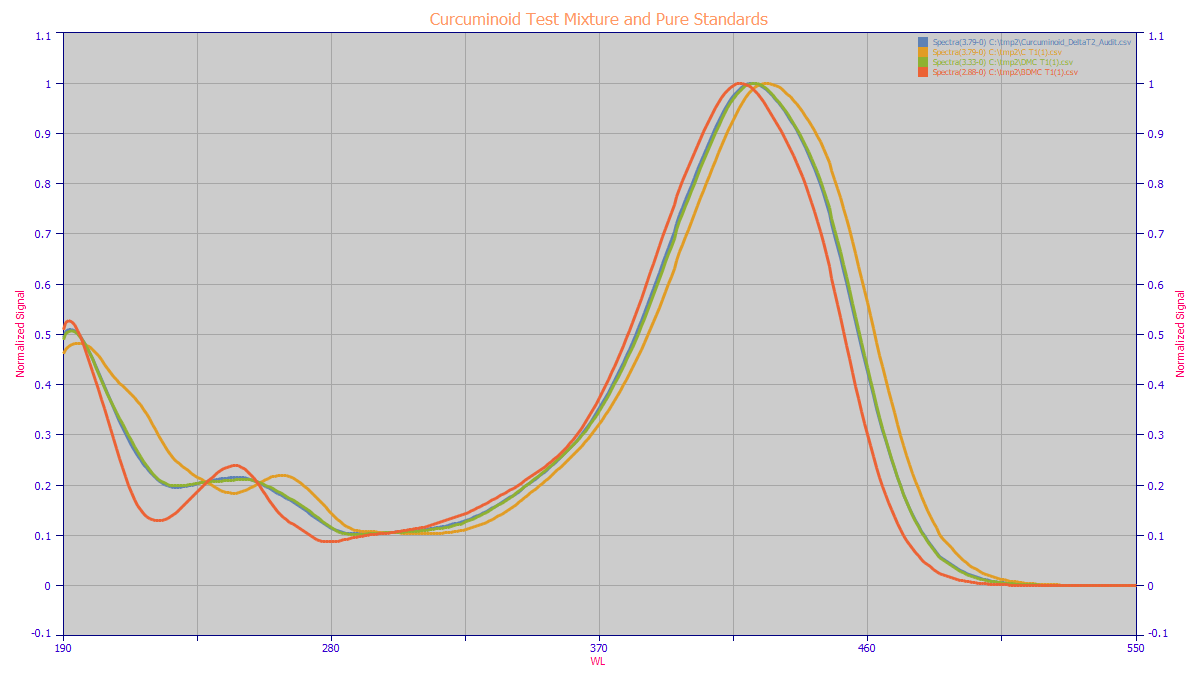
Interestingly, the blend of the three spectra produced very close to the spectra of the DMC (blue
and green below). Note that the MCR-ALS has only the 417,421,425 nm VIS apex differences, and the much
more pronounced, though lower magnitude differences in the lower WL UV band, to differentiate the three
discrete components.
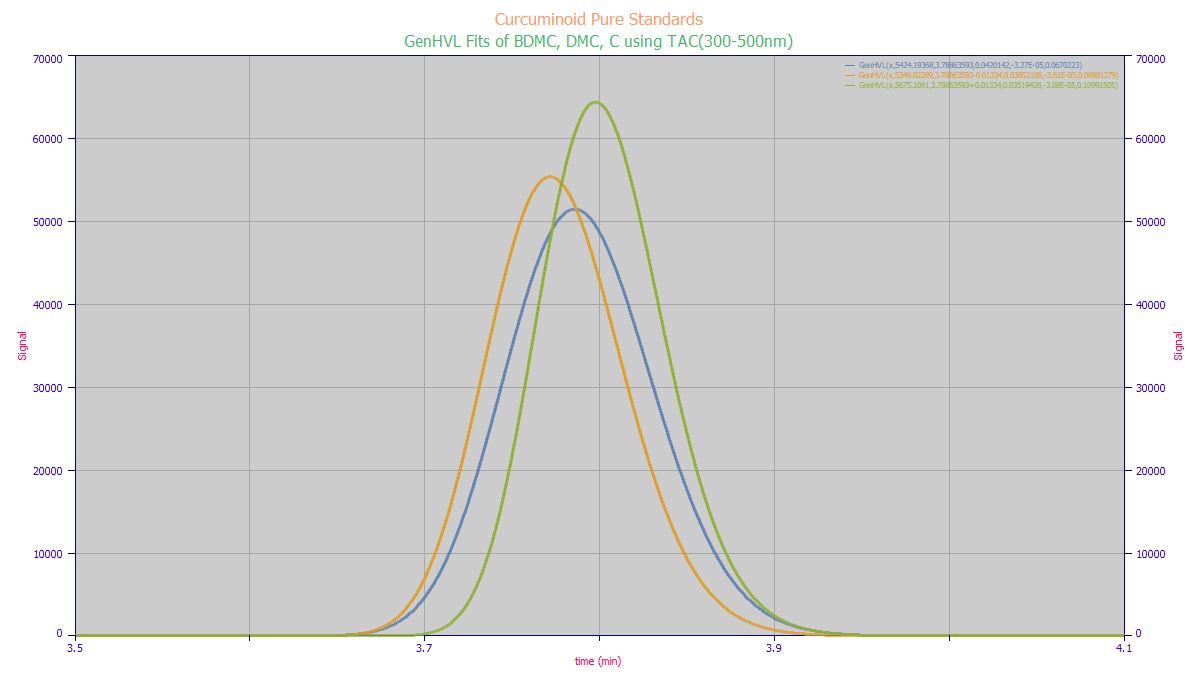
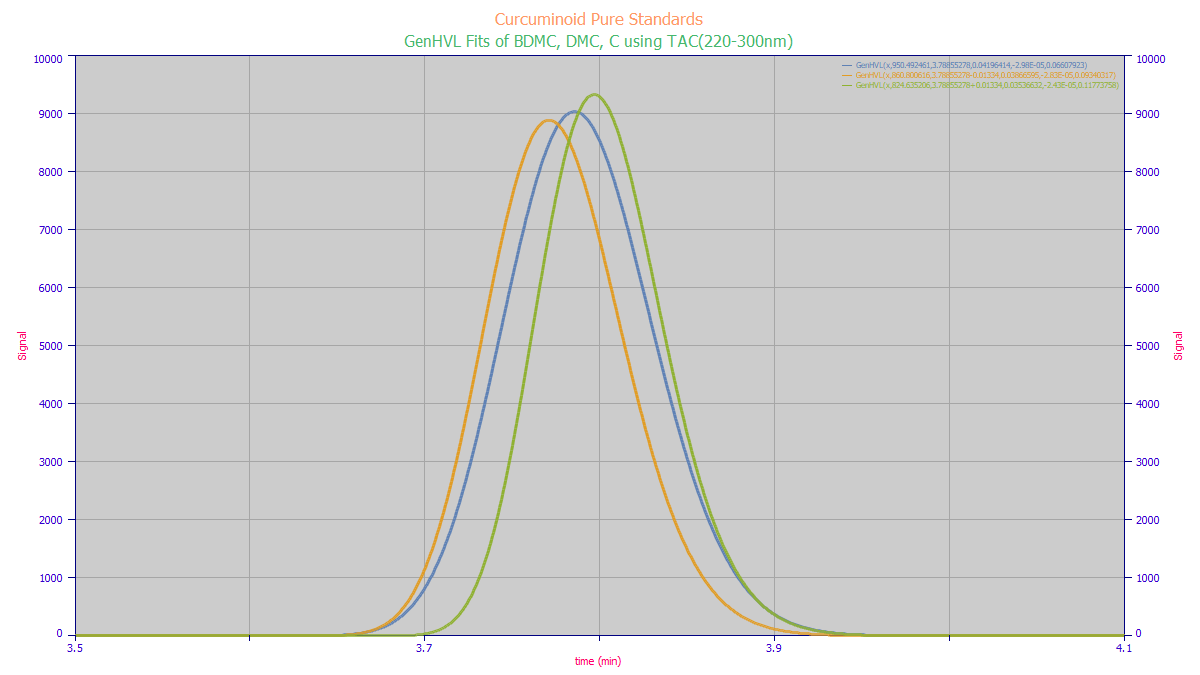
We begin with an estimate of the MCR-ALS answer we would like to see. This is the fit of the three
standards to a GenHVL with the 2 delta-time shift in time locations for the DMC and BDMC:
For this informed test, we use the following settings:
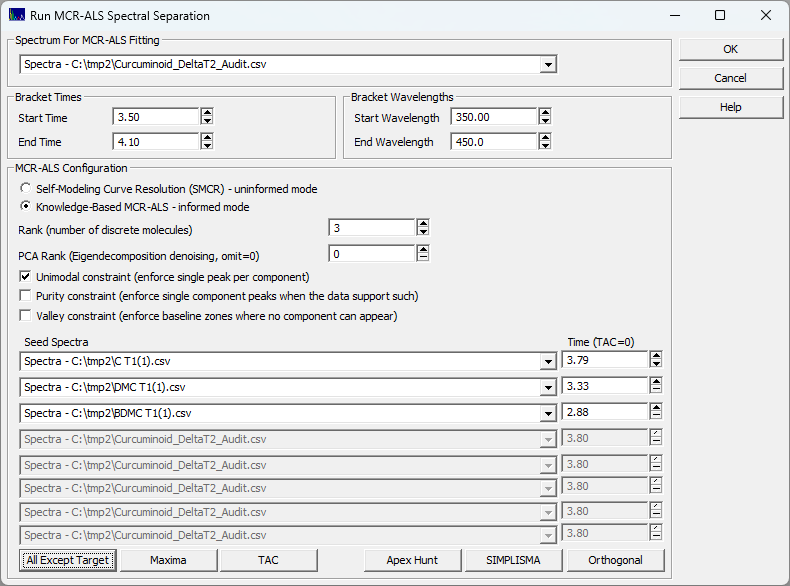
The times in the seed spectra correspond to the apexes in these standard runs and do not reflect the
shifts to introduce the coelution. We must also specify the unimodal constraint (each component in the
rank must be a separate discrete unimodal peak).
.png)
While the MCR-ALS recovered components do not exactly match the total wavelength chromatography of
the standards For this extreme test, the ordering by amplitude, location, and width are correct. When
separating components for quantitative analysis, you must use informed MCR-ALS with the spectra derived
by known standards, and even then you should be cautious. The rotational ambiguity in the algorithm introduces
an unfamiliar modeling complexity even to those experienced with conventional nonlinear modeling. There
is also the issue that the rank you expect may not be what MCR-ALS sees. In the lower plot we see that
the C spectra added a 325-375 nm absorption which fits with certain photodegradation studies. Indeed,
instead of 3 components (C, DMC, BDMC), the matrix might physically contain up to 6 components (the trans
and cis forms of each). When these kinds of complication arise, you may need to increase the rank or turn
off the unimodal constraint.
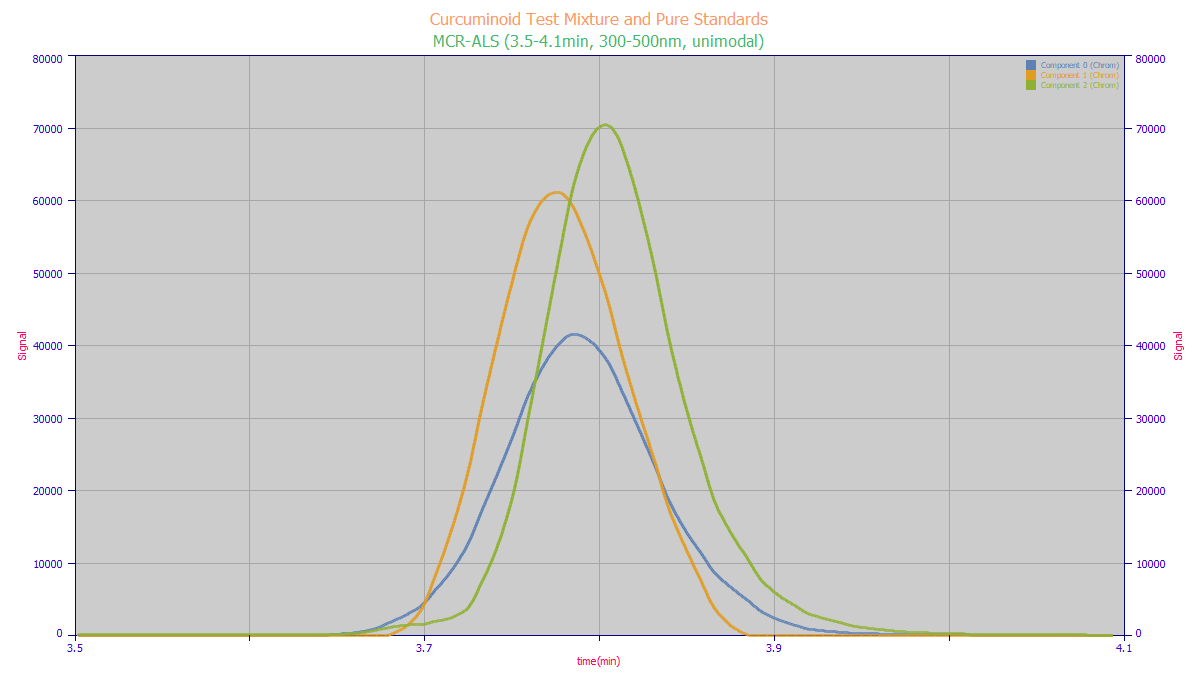
We mentioned that the UV band, though having a weaker S/N, offered a stronger differentiation between
the components. Here it is fair to keep in mind that any kind of competing impurity would be likelier
in this UV band. The following plots show the expected TAC for the 220-300nm UV band and the MCR-ALS rank
3 chromatographic and spectral separations. It is likewise imperfect, and this is with informed starting
spectra having a 99+% purity.
.png)
.png)
References
Tauler, R. (1995). Multivariate curve resolution applied to second order data. Chemometrics and Intelligent
Laboratory Systems, 30(1), 133–146. https://doi.org/10.1016/0169-7439(95)00047-X
de Juan, A., Jaumot, J., & Tauler, R. (2014). Multivariate Curve Resolution (MCR). Solving the
mixture analysis problem. Analytical Methods, 6(14), 4964–4976. https://doi.org/10.1039/C4AY00571F
Acknowledgements and Thank You
The PeakLab authors would like to especially thank Dr. M. Farooq Wahab, Dr. Daniel W. Armstrong, and Siddharth Jaya Sajeevan J of the University of Texas, Arlington, for sharing the chiral data in the first example from their groundbreaking work. Their reference is below:
Siddharth Jaya Sajeevan J, *M. Farooq Wahab, Daniel W. Armstrong, Selective Chemometric Elimination of
Co-Eluting Components in Chiral and Achiral Liquid Chromatographic Analyses, Analytical Chemistry, Vol
97/Issue 34, August 21, 2025
https://pubs.acs.org/doi/abs/10.1021/acs.analchem.5c03634
Dr. Wahab shares our passion for deriving as much information as possible from the DAD/PDA spectral
matrix data in UHPLC separations, and was instrumental in PeakLab v2 seeing this MCR-ALS capability as
well as the D1
component erasure function