PeakLab v2 Documentation Contents R2N Software Home R2N Software Support
View DAD/PDA 3D Matrix
The ChromSpec
menu contains the View DAD/PDA 3D Matrix... option for a full resolution contour display
of all data in the matrix. You must first import
spectra for this procedure to be available. It is a fast rendering of all of the data in the DAD/PDA
matrix, and should not be used for the D1
zeroing of components. For the determination of the D1 wavelengths, the Reduce
DAD/PDA 3D Matrix.. should be used.
![]() The Logarithmic Z graph button in the View DAD/PDA 3D Matrix plots offers a third SymLog
Z-scale option. With the RdBu_r colormap (or another that goes to white at 0), you can judge the
efficacy of the background
subtraction. Here we see the efficacy of the lsrpls on a UHPLC separation with a strongly varying
gradient baseline. This is important for the Filter
DAD/PDA Baseline option for determining the efficacy of the background filtering.
The Logarithmic Z graph button in the View DAD/PDA 3D Matrix plots offers a third SymLog
Z-scale option. With the RdBu_r colormap (or another that goes to white at 0), you can judge the
efficacy of the background
subtraction. Here we see the efficacy of the lsrpls on a UHPLC separation with a strongly varying
gradient baseline. This is important for the Filter
DAD/PDA Baseline option for determining the efficacy of the background filtering.
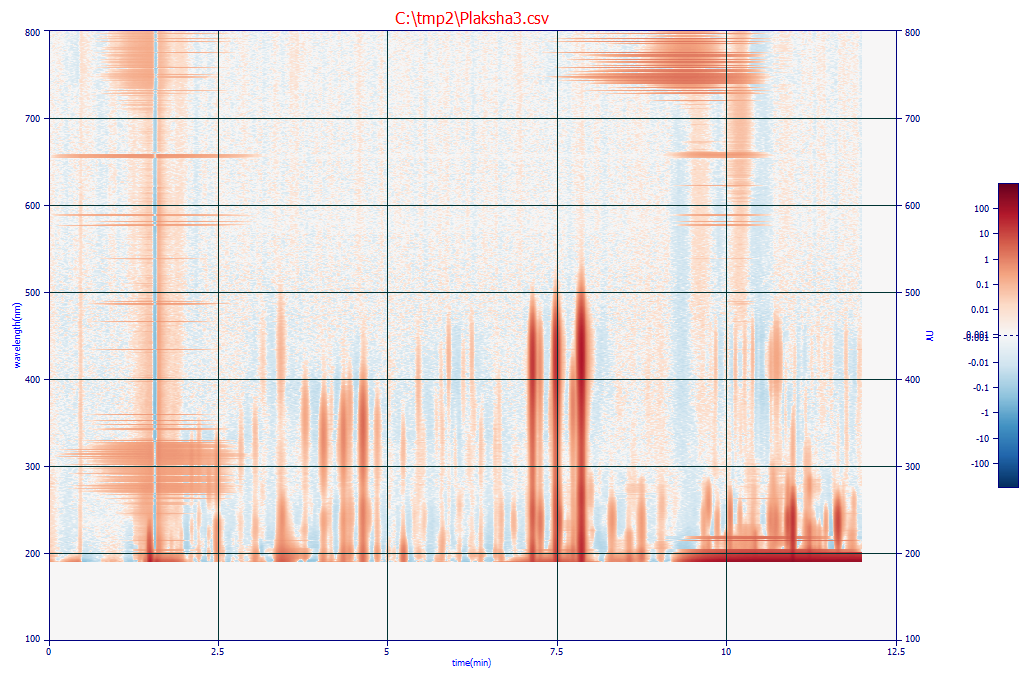
In this visualization, there is a symmetrix log scale that allows very close to 0 values to be plotted
with light red or blue colors. It allows you to see the effectiveness of the Whittaker
algroithms across all 611 wavelengths in this PDA matrix. This represent an excellent background
subtraction.
If you look closely, you will see the many trace close-to-baseline components as well as the wavelengths
where each of those components are signaled. The early and late eluting bands are the dead-time solvents
and the final isocratic
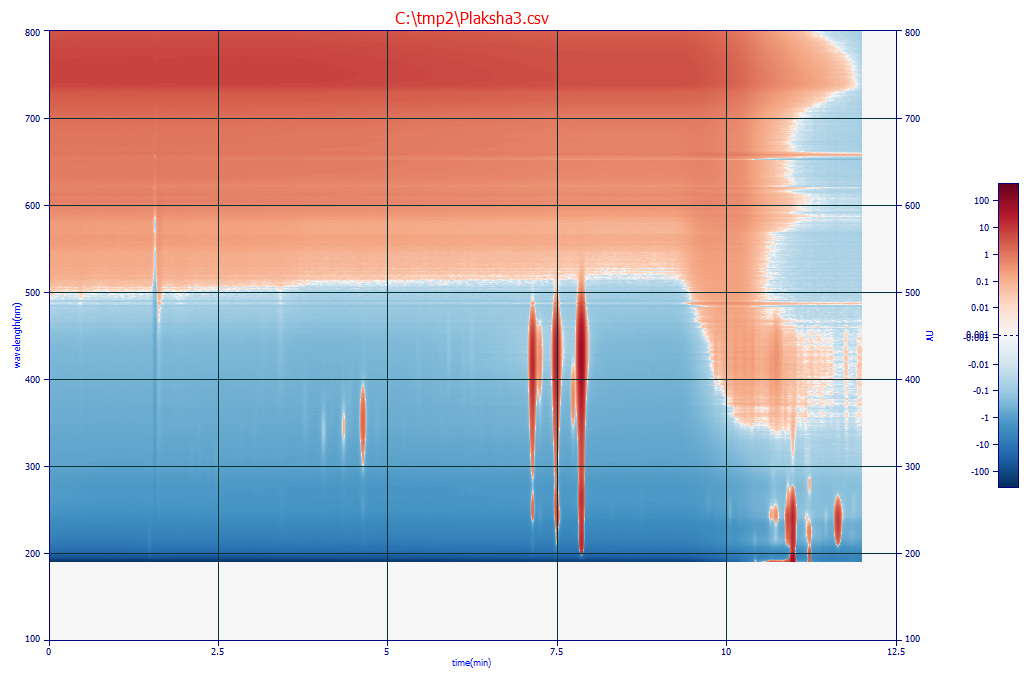
This is the matrix for this gradient UHPLC separation without this background
filtration step. The gradient will generally make it very difficult to visualize the close to baseline
threshold components in the 3D contour.