PeakLab v1 Documentation Contents AIST Software Home AIST Software Support
Map Experimental Process Variables
In the Explore option in PeakLab's Review, the various graphs can be constructed with experimental process variables that you assign to the data sets. This feature is also use to automatically generate spectral data matrices for modeling.
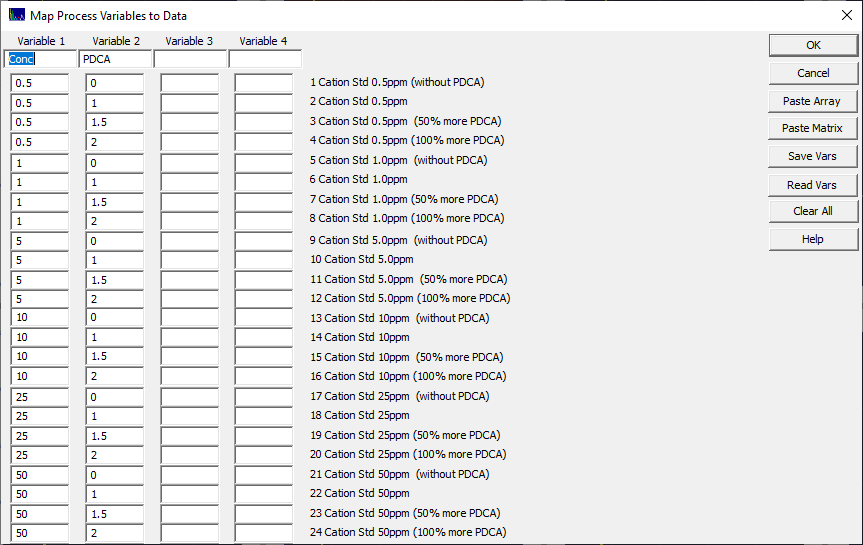
The right click menu Map Experimental Process Variables for Fitted Data Sets... option opens a dialog for this assignment. This option can be selected from the main data window graphs and in the Review window graphs.

In this example, an experimental matrix was run with concentration and additive level. By assigning the actual experimental values to the various data sets, you will be able to directly plot any property, parameter, or moment, for any given peak, in the Explore option. These assignments are saved as part of the the PeakLab data file.
You can assign up to four process variables to each data set.
If this is spectral data, the variables will be the Y-reference values for the modeling.
Paste Array
Use the Paste Array button to paste a given array that was copied to the clipboard into the table. In Excel, you can copy a column or a row and these values will be inserted into the matrix of process variables. Place the cursor in the field where you want the paste to begin. If the cursor is not in one of the fields in the matrix, the paste will begin in the first position of the first variable.
Paste Matrix
Use the Paste Matrix button to paste a block of data that was copied to the clipboard into the table. In Excel, you can copy a block of up to 25 rows and 4 columns that will be inserted into the matrix of process variables. Place the cursor in the field where you want the matrix paste to begin. If the cursor is not in one of the fields in the matrix, the paste will begin in the first position of the first variable.
Save and Read Variable Names
Use the Save Vars to save the four variable names to disk to use in different data files, and Read Vars to import the saved variable names. These are binary files with .VAR extensions.
Clear All
Use the Clear All button to clear all data and variable names.
Spectral Modeling
The Build GLM Data Matrix from Spectral PFD Files... item in the Model menu is used to construct a spectral data matrix using the program's PFD data files. If the PFD data files contain an experimental process variable matrix, those variables will be written as the Y-reference values in the modeling data matrix.
View and Compare Data
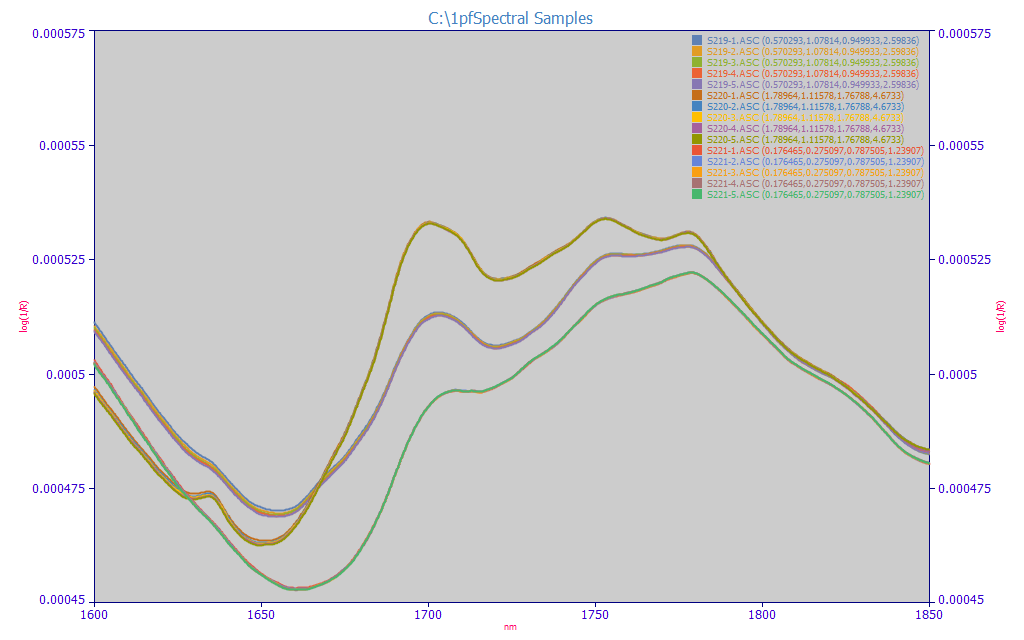
When experimental process variables have been set, these are also added to the legend in the View and Compare Data option. These values will be appended and in parentheses:

Data Sort
When experimental process variables have beet set, there will be right click menu options in the main window to rearrange the data sets in ascending order for each of the variables you have defined.


 |