PeakLab v1 Documentation Contents AIST Software Home AIST Software Support
Voigt Deconvolution
The Voigt model is generally seen as the theoretical model for most spectral peaks where there is both natural line broadening, and Gaussian broadening from instrumental and probabilisitic effects. For astronomical spectra, a Gaussian component also arises from Doppler broadening.
Analytic Voigt Model
With respect to Voigt deconvolution, the parameterization of principal importance is the following:
Voigt (Area, Gaussian and Lorentzian Widths)
The Voigt peak fitting the two widths directly with a0 as the peak area is defined as follows:
a0 = Area
a1 = Center (mode)
a2 = Gaussian Width (SD)
a3 = Lorentzian Width
In this parameterization, the Gaussian and Lorentzian widths appear directly as a2 and a3.
Identifying the Gaussian and Lorentzian Widths in Data with Overlapping Spectral Peaks
In order to deconvolve spectra, you will want to peak fit the spectra to estimate the Gaussian and Lorentzian widths for your data.
If you have a single baseline-peak, this is straightforward and you use the Fit Local Maxima Peaks option. If there are multiple overlapping peaks in the spectrum, you will generally use the Fit Hidden Peaks Second Derivative option with a smoothing level, derivative threshold, and amplitude threshold that produces a good starting count for the peaks. You should also uncheck the Vary width a2 and shape a3 options so that a single a2 Gaussian width and a single a3 Lorentzian width is fitted for all of the Voigt peaks comprising the spectral feature.

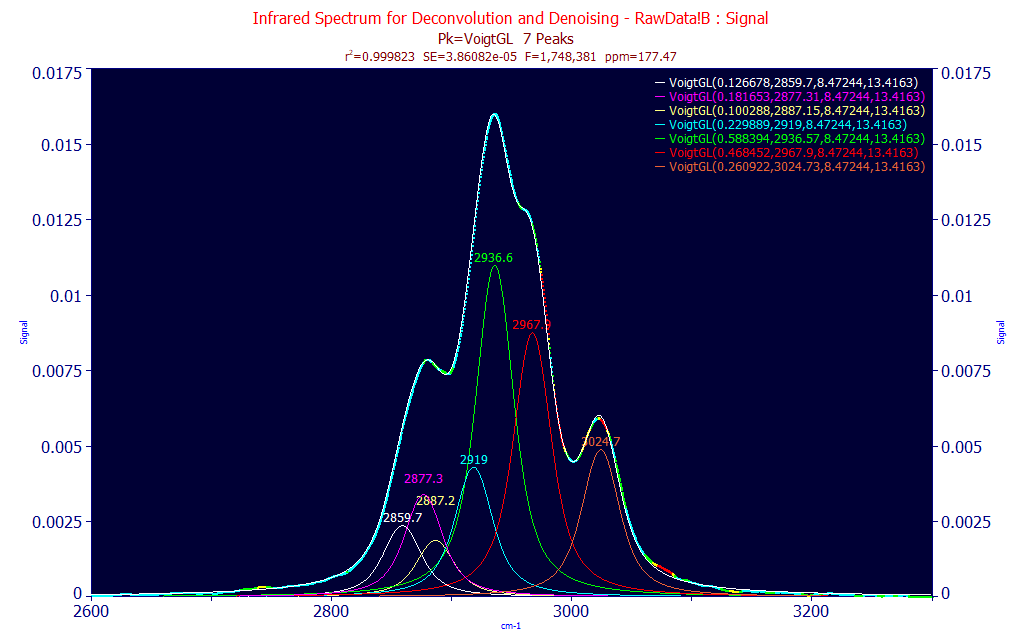
In this example using IR data, the Voigt peaks optimize at a count of 7 by the maximization of the F-statistic. If we add an eighth peak, the F-statistic decreases even though the rē increases. An additional overspecified peak may also fit wholly within the interior of another peak with very close to an identical center value. In the above fit, the VoigtGL fit estimates a Gaussian width of 8.47 and a Lorentzian width of 13.4.
Deconvolution using the <v> Voigt Instrument Response Function
If you wish to preprocess spectral data using a deconvolution, you should first section and baseline correct the sectioned data. The Voigt IRF then offers deconvolving the Gaussian, the Lorentzian, or any amount of either broadening.

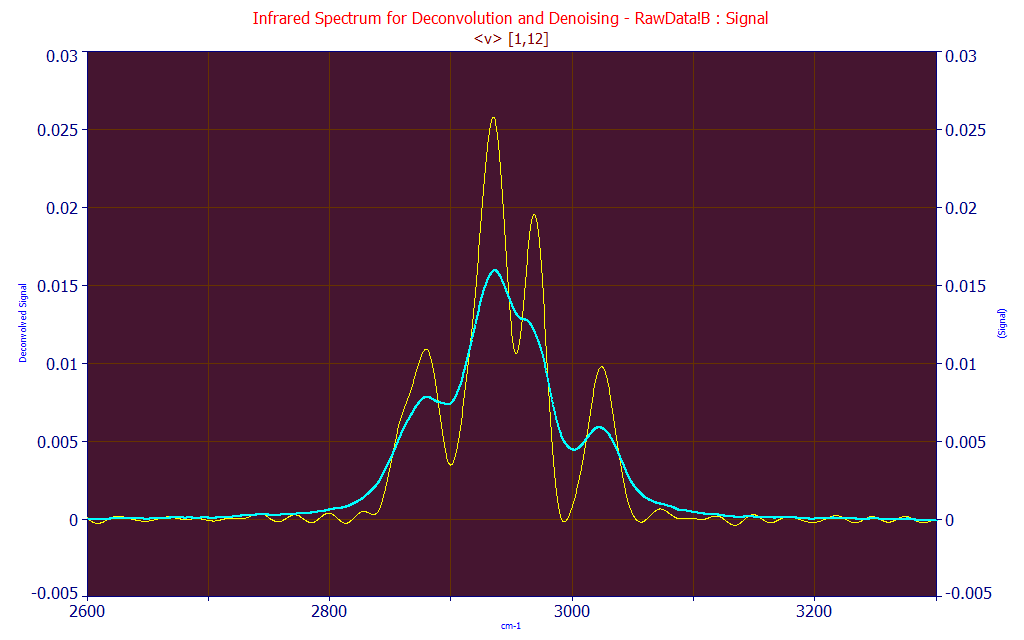
In the IRF Deconvolution option, this is what the Voigt<v> two-sided deconvolution looks like with a Gaussian width of 1 and a Lorentzian width of 12. Because the Lorentzian has a slow decay, primarily deconvolving the Lorentzian produces a significant sharpening of the spectra. For this data the Min Automatic Fourier filter was used with a specified range of 10% of the spectral frequencies. At this point, the four peaks in the raw data are easily seen as five.

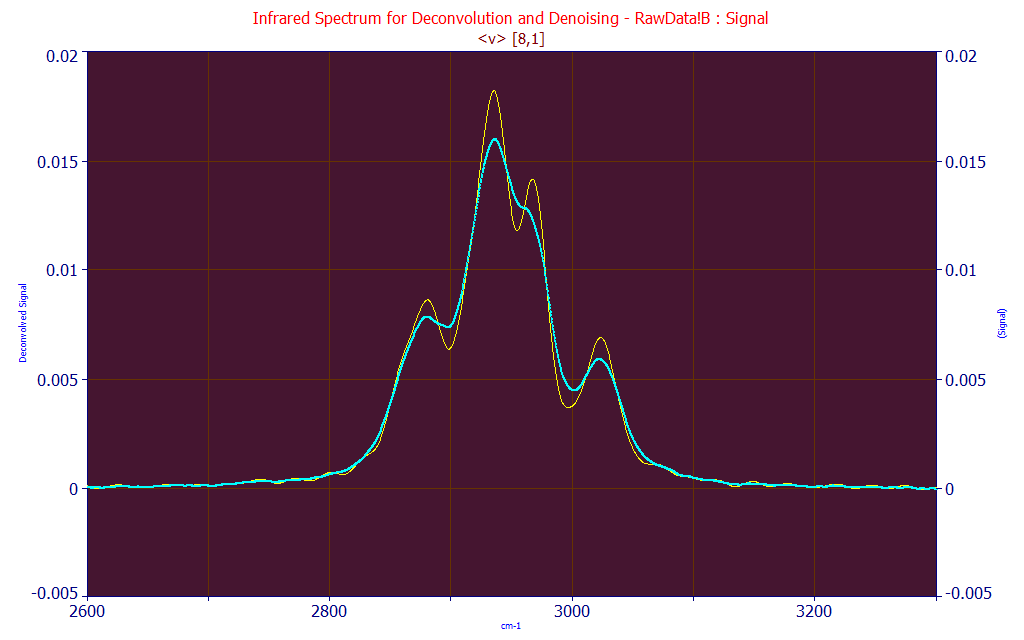
If we use the same IRF Deconvolution option, this is what the Voigt<v> two-sided deconvolution looks like with a Gaussian width of 8 and a Lorentzian width of 1. A Gaussian has a very compact decay, and as such, primarily deconvolving the Gaussian produces far less sharpening of the spectra.

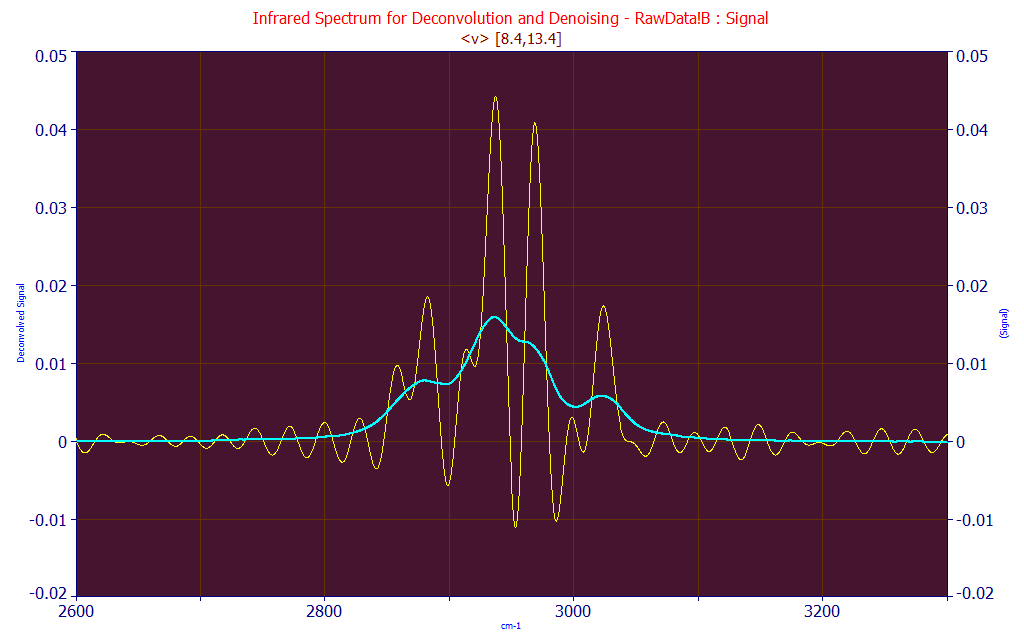
What happens if we attempt to deconvolve both the Gaussian and the Lorentzian width that make up the total broadening in the Voigt? We do not get a zero baseline nor, as a consequence of a carefully determined Fourier filter, do we see pure noise. Instead, we see a clear indication of seven peaks within the spectral feature. A Voigt deconvolution is a useful sharpening technique for identifying hidden peaks.
For laboratory data, you may wish to deconvolve a Gaussian to remove the instrumental distortions and leave only the Lorentzian natural broadening. Most point spread functions in a spectrometer are assumed to be Gaussian. Because the convolution of a Gaussian with a Gaussian is also a Gaussian with a width that is the square root of the sum of variances, there are limits to how much of the Gaussian can be effectively removed before noise becomes dominant. You may find it of value when doing a two-sided Gaussian deconvolution to add a small measure of Lorentzian in a Voigt IRF.
 |