PeakLab v1 Documentation Contents AIST Software Home AIST Software Support
GLM Graph Titles
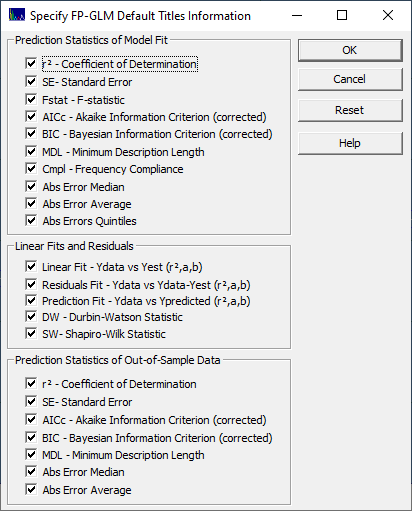
Use the Graph Titles button in the GLM Review to control the information shown in the direct spectral fit model plot titles.


The titles shown in the GLM model graph are set individually in the dialog.
![]() You can use the 2D
Custom Titles to independently set your own titles and font sizes.
You can use the 2D
Custom Titles to independently set your own titles and font sizes.
This Graph Titles option will set the individual items that are inserted into the automatically generated titles for the GLM Review window model plot.
The Prediction Statistics of Model Fit specify the prediction goodness of fit and error values to be displayed in the second and third titles. These will be based on the prediction errors specified in the Prediction Errors set at the time of fitting. In the Fit GLM Models option, you can specify the Leave One Out or two different forms of Random Sampling. The type of prediction error is shown in the GLM Numeric summary.
The Linear Fits and Residuals settings control the information from the linear fits of the y-known vs. y-estimated and y-known vs. y-residuals plots in the fourth title. You can also choose to display the Durbin-Watson and Shapiro-Wilk statistics.
![]() Use the Confidence
Intervals button in the graph toolbar to control the prediction interval for the linear fits.
Use the Confidence
Intervals button in the graph toolbar to control the prediction interval for the linear fits.
If the Prediction option was used, there will be a fifth title consisting of the errors associated with the Prediction Statistics of Out-of-Sample Data. The prediction data data are assumed to be blind data (spectra nowhere fit in the modeling) that are used to evaluate the efficacy of the predictive model. If the original fitted data is input in this Prediction procedure, this fifth title will display the model (estimation or calibration) goodness of fit, the values that appear in the Fit Statistics section of the GLM Numeric summary.
 |