PeakLab v1 Documentation Contents AIST Software Home AIST Software Support
GLM Review
The GLM Review consists of a set of graphical and numerical windows which cover the following:
Main Window Graph of Model/Residuals
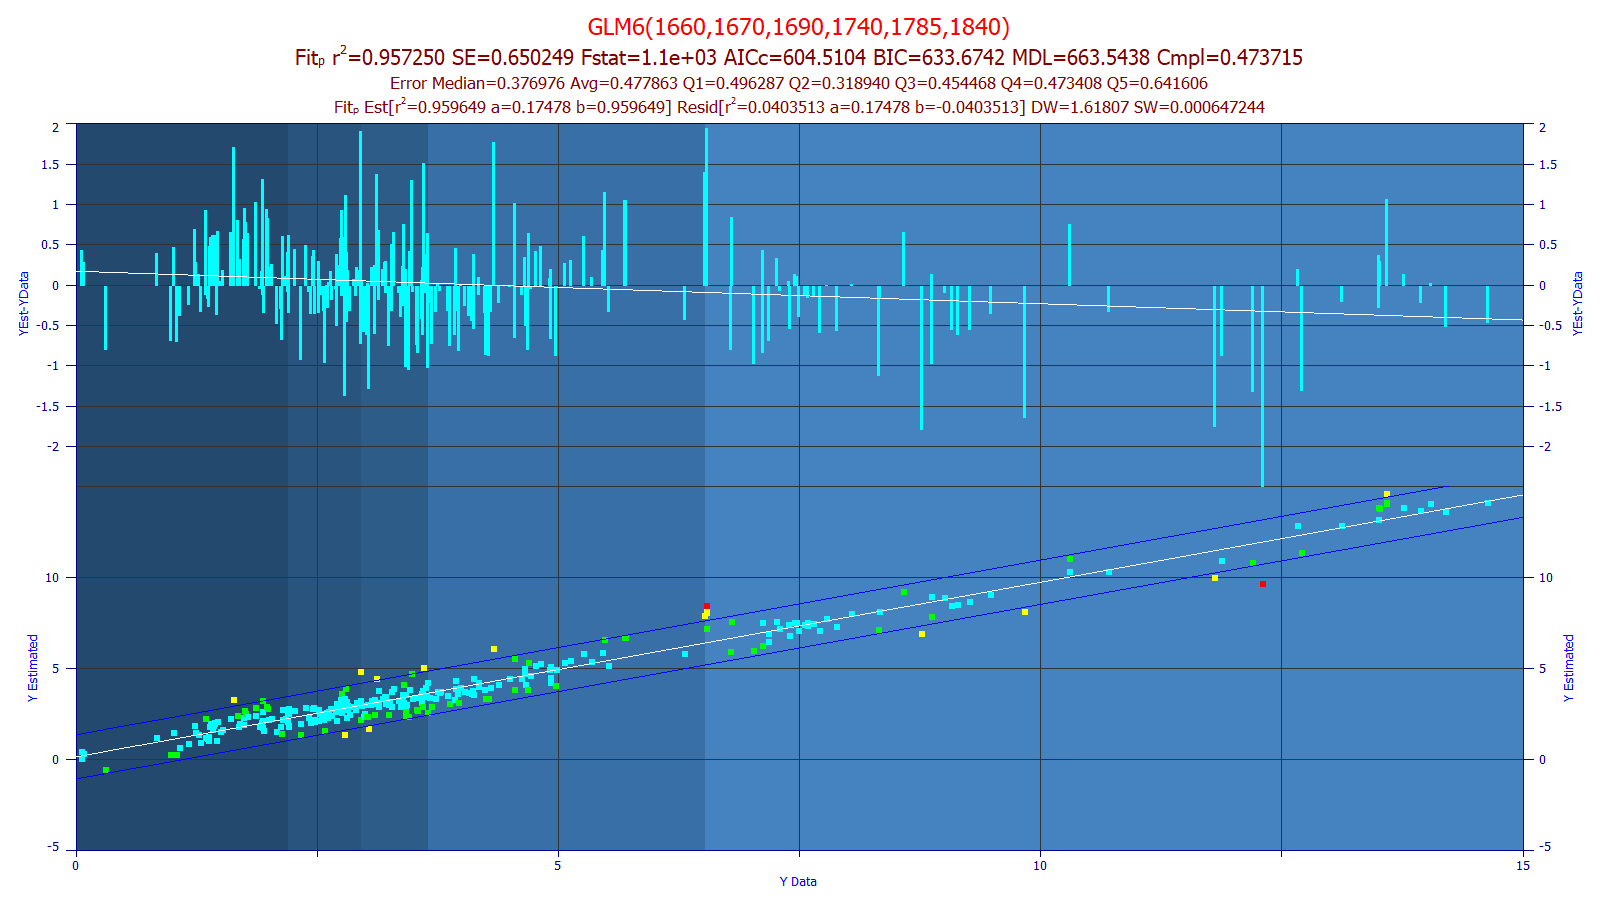
If a prediction data matrix has not been imported using the Prediction button, the main graph window will consist of an upper graph containing both a Y and Y2 axis. The Y data vs Y estimate graph of the model data will be plotted on the Y axis along with a linear fit and prediction/confidence intervals of the x=Y data, y = Y estimated, y=a+bx linear fit. The residuals as Y estimated - Y data will be in the Y2 plot. The traditional definition of the Residuals are reversed so that an estimated value greater than the data value that appears above the fitted line also appears as a positive residual above the zero line. The residuals also include a y=a+bx linear fit. By default, the upper graph's background will reflect the quintiles of the Y-data.

Main Window Graph of Model/Prediction
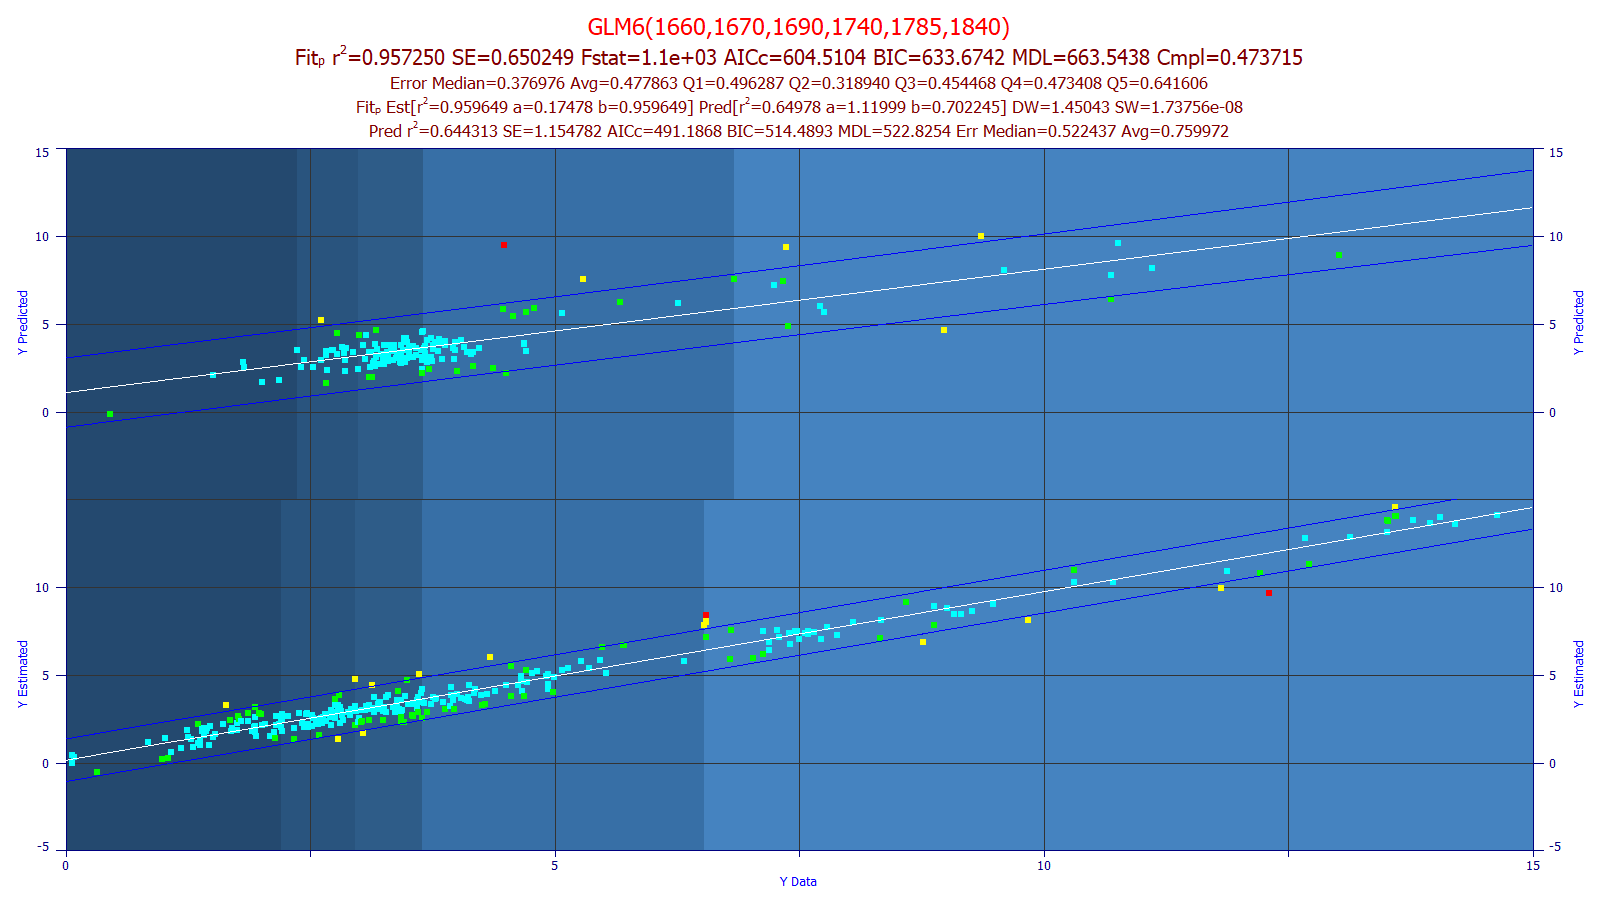
If a prediction data matrix has been imported using the Prediction button, the main graph window will consist of an upper graph with the prediction in the Y2 plot and the model fit in the Y plot. The prediction plot is analogous to the model plot, except the data consists of the imported prediction matrix data and the fit is the done using this data and its predicted estimates. The default graph titles will contain one additional line of information specific to the prediction.

Main Window Graph of Significance of Predictors
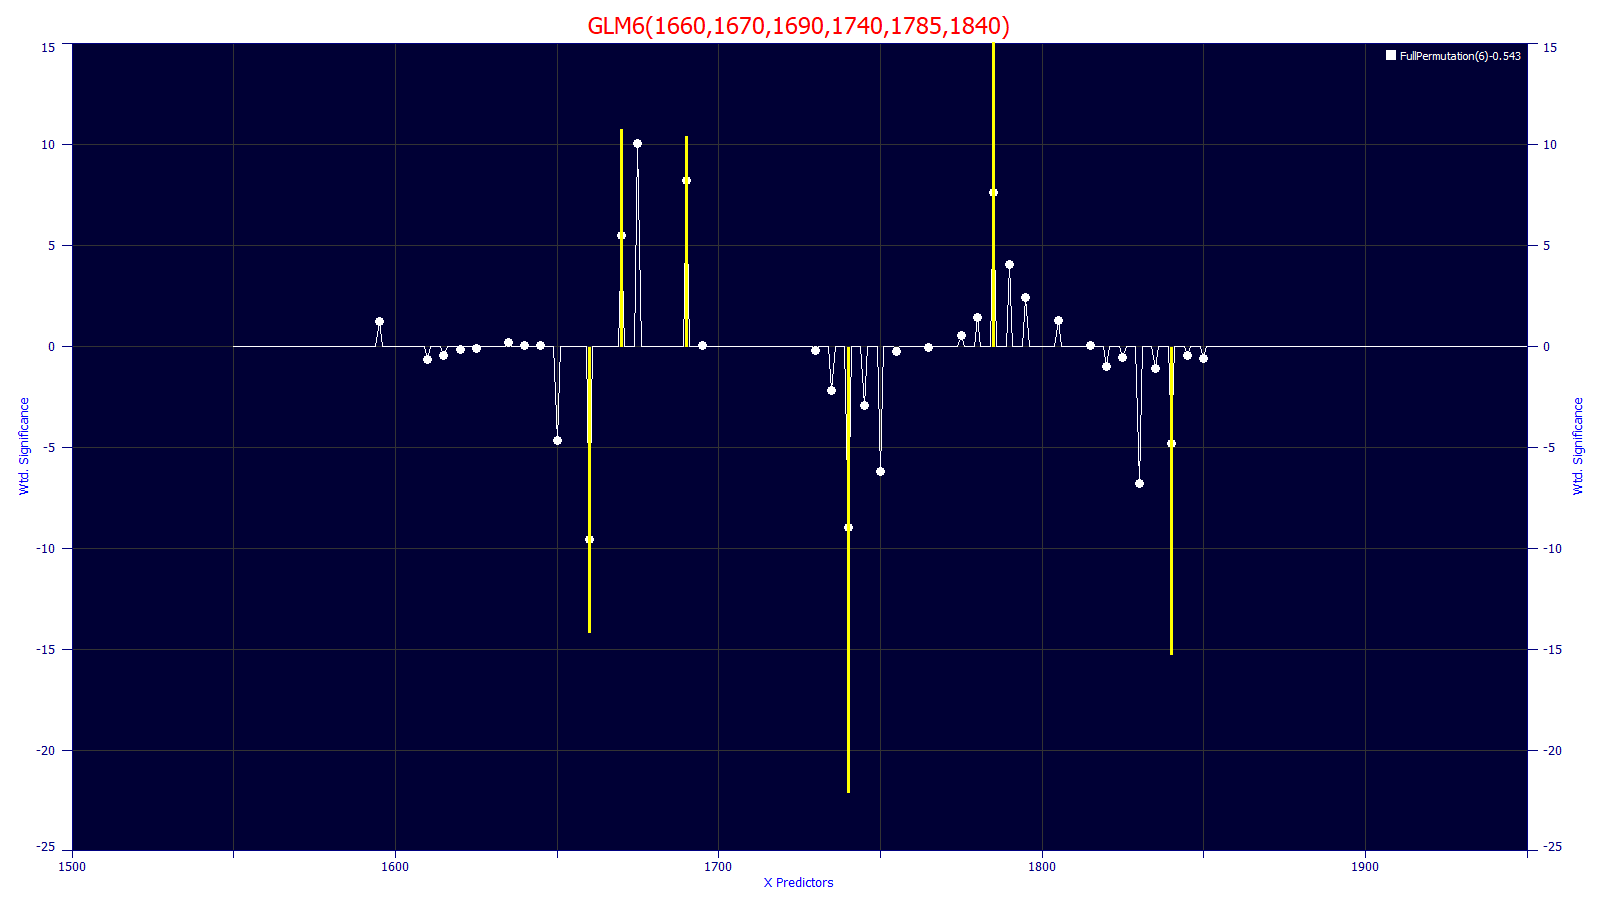
The lower graph consists of the significance of this specific model (the t-value and location of each of the predictors). This is overlaid with the signed significance plot for the all retained models of this same predictor count. This reference consists of the sum of the t-values at each wavelength for the retained models of that predictor count, normalized by the total count of predictors across these same retained models. For this reference, a wavelength that appears as a strong predictor in many retained models will have a large magnitude significance peak. A significance of zero means that the wavelength did not appear in any of the retained models of that specific predictor count.

One advantage of the full permutation modeling is that a large count of near-optimal fitted models provide a map of the wavelengths/frequencies that furnish effective predictions as well as their significance. In the above plot, the six wavelengths in the model strongly map to the wavelengths and average significance from the one-hundred retained 6-parameter models. This six-predictor model is deemed strongly 'compliant' with the overall body of effective six-predictor models. PeakLab defines a compliance metric which can be used to sort models of a specific predictor count. This metric is described in the GLM Model List topic.
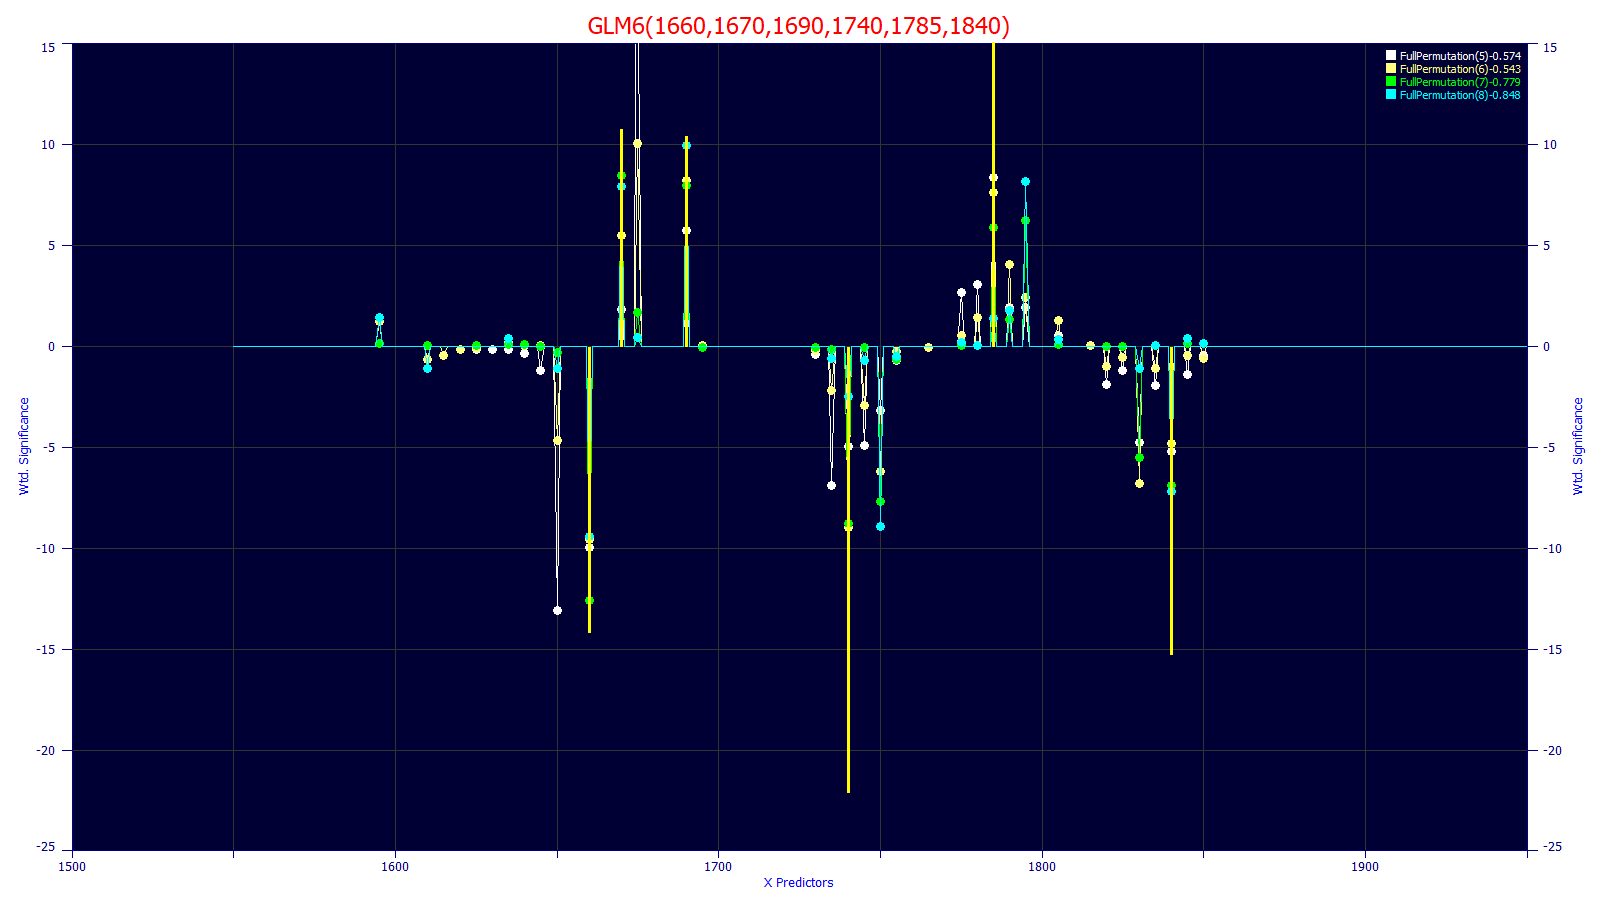
By selecting only certain predictor counts in the Filter menu of the Model List, you can use the Display the Average Significance Map for all Counts of Predictors right click menu option in the main graph to plot all of the significance for all of the model counts currently included in the list. The following is the lower significance plot for the 5,6,7,8 predictor counts. Note the overall consistency for these average significances and locations across the predictor counts:

These plots are automatically updated each time a different model is selected for review.
The GLM Review is designed to have as much information at your fingertips as your screen real-estate permits. You will likely find a decided efficiency benefit if you have a large 4K monitor, or multiple monitors where all of the different windows can be simultaneously displayed and refreshed each time a different model is selected in the Model List.
Model List of All Retained Models from the GLM/Stepwise Fitting
The Model List is always displayed by default. The List menu has a Keep List after Selection item which can be turned off to hide the list when reviewing a specific fit. If you use this, you will need to click the Model List button in the main window to redisplay the models. This window is a large selection list. Simply select the model you wish to review.
You can choose from a large set of prediction metrics in the list using the List menu. You can also choose to display all or just the default metrics. You can also select the font and its size as well as whether or not the list is displayed in color. Values which improve with increasing value are shown in red, such as rē, and those which improve with decreasing value are shown in blue, such as the different estimates of error.
The Filter menu allows you to individually toggle the different predictor counts on and off. You can also limit the list to just the GLM fits, or to just the stepwise fits.
Numeric Summary of the Currently Selected Fit
The Numeric button in the GLM Review opens a window containing the Numeric Summary for the fit of the model currently selected. This will always be an RTF (rich text format) window where individual content can be highlighted and copied. This summary is automatically updated each time a different model is selected in the Model List.
Data-Residuals Summary of the Currently Selected Fit
The Data button in the GLM Review opens a Data Summary window containing the sample by sample error information for the fit of the model currently selected. This will be an RTF (rich text format) window where individual content can be highlighted and copied, provided the data size is less than 2048. For larger sets, a much faster display procedure is used for accommodating the display of up to the program's N=50,000 built-in data limit. This summary is automatically updated each time a different model is selected in the Model List.
Prediction Summary of Currently Selected Fit Using Separately Imported Predicted Data
The Prediction button in the GLM Review first opens a file selection window where you must specify a file containing the data matrix that will be used to evaluate the prediction accuracy of model. The prediction data will usually be out-of-sample data (that which was nowhere used in the design model), but it can be any data matrix, including the data that was used for the original modeling.
You can only access the Prediction procedure from the GLM Review. This is opened at the conclusion of any current fit, or in loading any saved fit (these are binary files with BIN extensions).
The prediction data's X-predictor names or WL/Wn values must match those in the design data. The prediction data's Y value column must be specified if its name doesn't match with any of the column names/identifiers in the design data matrix file. If the Y data does not exist, you must check No Y data is available.
Once the prediction data has been loaded, a Prediction Summary window is opened containing Prediction statistics and the sample by sample prediction information for the model currently selected and graphed in the GLM Review. This will be an RTF (rich text format) window where individual content can be highlighted and copied, provided the size of the predicted data consists of less less than 2048 data samples/spectra. For larger sets, a much faster display procedure is used for accommodating the display of up to the program's N=50,000 built-in data limit.
The purpose of the GLM Prediction procedure is to evaluate the predictive accuracy of individual fitted models, and possibly to see the prediction statistics of the original design data when possible data outliers are omitted post-fitting by one or both of two different methods.
Significance Graph of All Retained Models at each Predictor Count
The Significance button in the GLM Review opens a Significance plot of the overall predictors in the model set. This is a comprehensive visualization of the whole of the fitting, and includes the full permutation GLM models, and if fitted, the smart stepwise models, and the sparse PLS models. This global significance plot is unsigned, meaning that |t| is used in the sums of the significance values. Because the absolute value is used, this global visualization does not give you a picture of whether or not a predictor adds to or subtracts from the prediction estimate, only which of the x-predictors or wavelengths are important.
The significance plot in the lower graph of the GLM Review shows a signed significance for the current count of predictors in the presently selected model. The reference in this 2D plot is a sum of the signed t-values at each predictor (x-value or wavelength) across all retained models having the predictor count of the currently selected model. This sum is normalized to the total count of predictors across those same retained models. In the Review's lower plot, you can use the Display the Average Significance Map for all Counts of Predictors right click menu option in the main graph to plot the signed significance for all of the model counts currently included in the model list.
 |