PeakLab v1 Documentation Contents AIST Software Home AIST Software Support
Graph Scaling
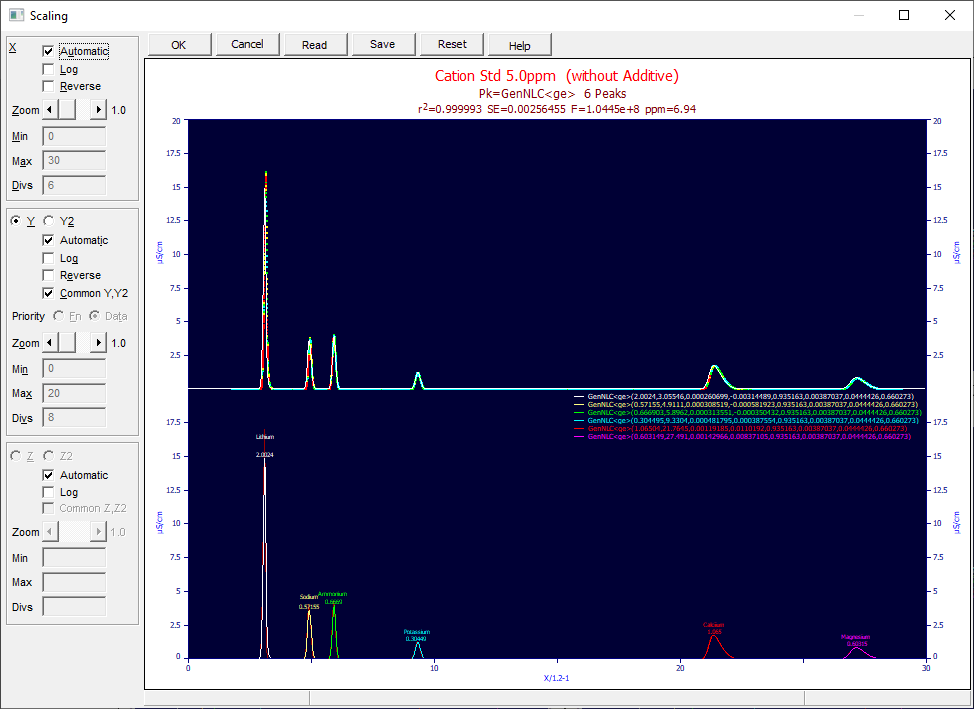
![]() When a 2D Graph is displayed, the Modify Graph Scaling option in PeakLab
Graphs toolbar offers all of the 2D scaling options in single dialog. All changes made in any of the
scaling options are immediately reflected in the graph. If there are multiple graphs present, only the
first is shown in this dialog.
When a 2D Graph is displayed, the Modify Graph Scaling option in PeakLab
Graphs toolbar offers all of the 2D scaling options in single dialog. All changes made in any of the
scaling options are immediately reflected in the graph. If there are multiple graphs present, only the
first is shown in this dialog.

This custom scaling option is used for special scaling needs. For zooming in any given graph, it is much easier to use the left mouse button, starting at one corner of the desired region and pressing and holding the button while moving the mouse to the opposite corner of the desired region. The zoom-in can then be cleared simply by right clicking the mouse anywhere within the graph region, except upon a point or function anchor, and selecting the Restore Scaling - Undo Zoom popup menu option.
The X, Y, and Y2, Z and Z2 (contour plot) axes are treated independently. The Y entry fields serve either the Y or Y2 axis, depending on whether Y or Y2 is selected. The Y2 options will not be available if the graph contains a single plot. Similarly, the Z entry fields serve either the Z or Z2 axis, depending on whether Z or Z2 is selected. The Z and Z2 options are only available if a contour plot is present in these positions.
The Automatic option produces PeakLab's default scaling for the particular axis. To manually scale an axis, this Automatic box must be unchecked.
The Log option will produce a logarithmic axis. No errors are reported for any data or functions which have negative values. The points or function simply will not be drawn. Some graphs, such as Residuals Graphs, use an absolute value when a log scale is used.
The Reverse option creates a descending rather than ascending axis. This may be of value in spectral plots where the X axis is wave number.
The Common Y,Y2 option specifies a common axis be used for both Y and Y2 plots. The ranges are simply adjusted to accommodate all information in both plots.
The Priority option allows you to have Y axes scaled for either Data or Fn (Functions). With a Data priority, the minimum and maximum in the primary data determine the scaling. With a Fn priority, the minimum and maximum of all functions plotted determine the scaling limits. If a user function is wholly out of control (nowhere to be seen amongst the data), changing from a Data to Fn priority may be of value.
The Zoom option enables an axis to be automatically zoomed out in ten increments. These steps will be linear for linear scaling. When the scale is logarithmic, alternating log units are incrementally added to each side of the scale.
The Min, Max, and Divs fields are active when manual scaling is used (Automatic is off). The values you enter are used exactly as the limits of the scale. The divisions field specifies the number of divisions, not the number of interior grid positions (the interior grid count will be one less than the number of divisions). For logarithmic scaling, you are free to set non-integer powers of 10, and subsidiary logarithmic grids will be drawn, although they will lack the traditional meaning.
![]() Grids are specified in the Graph
View option.
Grids are specified in the Graph
View option.
Reset
The Reset option restores default scaling.
![]() Default Scaling can also be reset within a PeakLab
Graph by clicking the Reset Default Scaling button.
Default Scaling can also be reset within a PeakLab
Graph by clicking the Reset Default Scaling button.
Save
The Save option will save a binary custom scaling [SCL] file to disk for future recall and use. You should save any custom scaling that you may wish to use for a number of replicate or similar data sets.
Read
The Read option imports a binary custom scaling [SCL] file previously saved.
To accept the custom scaling shown in the dialog and graph, simply click on OK. To abandon any modifications, click on Cancel.


 |