PeakLab v1 Documentation Contents AIST Software Home AIST Software Support
HVL (Full Range)
HVL (Haarhoff-Van der Linde) Model
This function is based upon the work of P. H. Haarhoff and H. J. Van der Linde (Analytical Chemistry 38, 573, 1966). This function was derived mainly for describing gas chromatographic systems where axial diffusion and axial dispersion are the primary sources of band broadening, and equilibrium conditions apply. The HVL function will also describe band profiles under certain conditions in reversed-phase chromatography.
All physical and chemical resistances to interphase mass transfer are neglected by the assumption of an equilibrium adsorption isotherm. A polynomial expansion is used to approximate the adsorption isotherm, and by adjusting the sign of the second order term, column overloading under both Langmuir conditions (tailed peaks) and anti-Langmuir conditions (fronted peaks) can be modeled.
A Full Dynamic Range HVL
The GenHVL template can be used with the Gaussian or normal PDF, CDF, and CDFc ZDD to produce an HVL (Haarhoff-Van der Linde) model that is capable of a wide dynamic range of distortions.
The HVL in previous versions of the PeakLab technology was defined as follows:
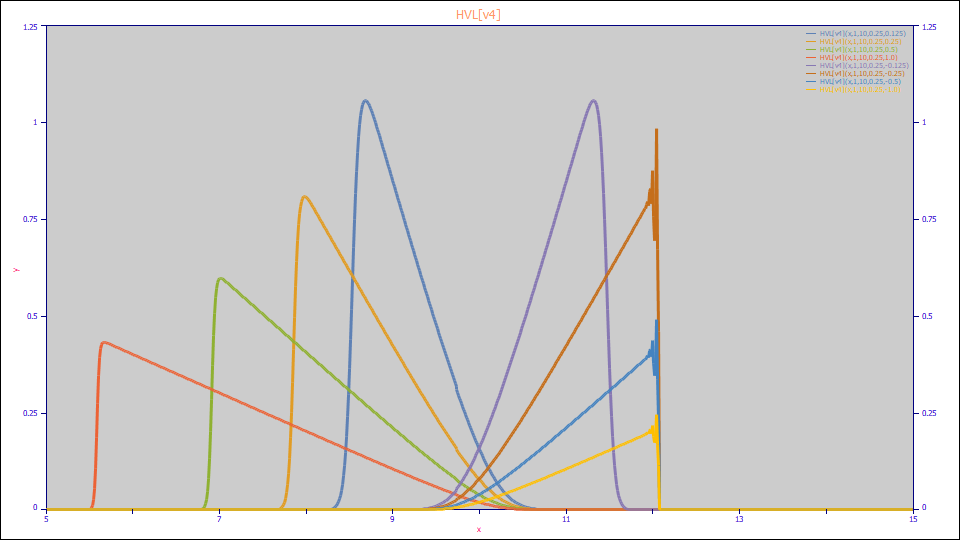
This model represents the simplest form of the HVL, where a linear slope is used for adsorption isotherm. This original HVL model remains available in PeakLab and is listed as the HVL[v4] in the built-in fitting functions and in view functions and user-defined peaks.
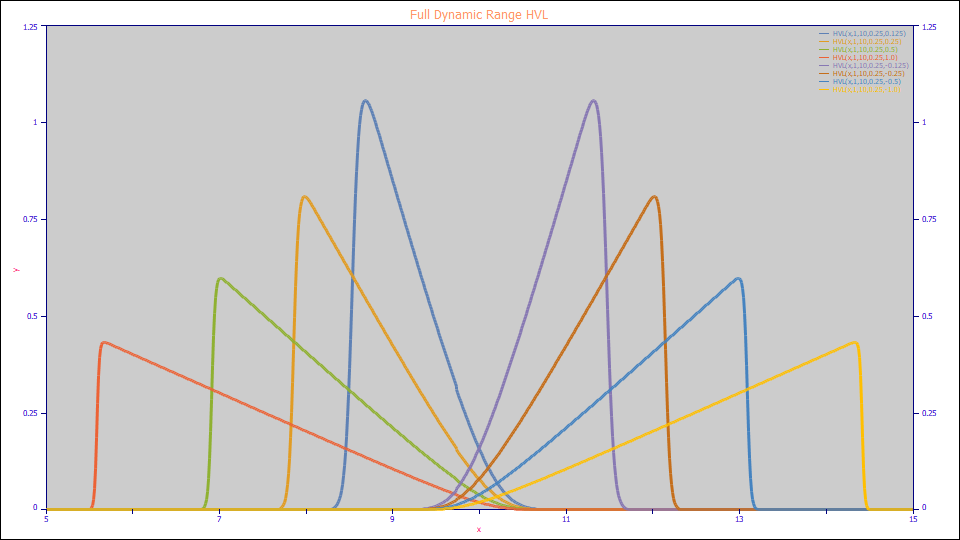
The GenHVL template can be used with the Gaussian or normal PDF, CDF, and CDFc to produce an HVL that is capable of a wide dynamic range of distortions:
With simplification, the HVL (full range) used in PeakLab is as follows:
a0 = Area
a1 = Center (as mean of asymmetric peak)
a2 = Width (SD of underlying Gaussian)
a3 = HVL Chromatographic distortion ( -1 > a3 > 1 )
Built in model: HVL
User-defined peaks and view functions: HVL(x,a0,a1,a2,a3)
The NLC and HVL models in PeakLab can be freely used without regard to computational performance or dynamic range of the chromatographic a3 distortion.
This is the dynamic range of the HVL prior to PeakLab (HVL[v4]). The loss of precision issues occur with fronted (negative distortion) peaks.

This is the dynamic range of the HVL in PeakLab.

HVL Considerations
Assuming the data has been properly transformed, the a1 “center” parameter is the true thermodynamic capacity factor k’. The time transformation can be carried out as follows: X=X/t0-1, where t0 is the dead time of the column. In the case of tailed peaks, k’ will be some time after the peak maximum. For fronted peaks, k’ is at a time before the peak maximum.
The a2 width parameter represents a “lumped” dispersion parameter that represents all non-ideal band broadening processes.
The a3 distortion parameter represents the curvature of the adsorption isotherm at the origin and has the following physical significance: a3 = -Y"C0 where Y" is the second derivative of the adsorption isotherm at the origin, and C0 is the amount of solute injected into the column. For Langmuir isotherms (downward curvature, tailed peaks), the distortion parameter is positive. For anti-Langmuir isotherms (upward curvature, fronted peaks), the distortion parameter is negative.
No physical significance can be ascribed to the statistical moments of the HVL distribution.
The HVL equation is best suited to fitting distorted peaks in gas chromatography, particularly those whose distortion is caused by overly large sample concentrations. The fitted parameters can yield the thermodynamic k’ and isotherm curvature if the chromatographic data was obtained under conditions consistent with the model’s assumptions.
This specific full-dynamic range HVL is part of the unique content in the product covered by its copyright.


 |