PeakLab v1 Documentation Contents AIST Software Home AIST Software Support
Printing Graphs
![]() PeakLab
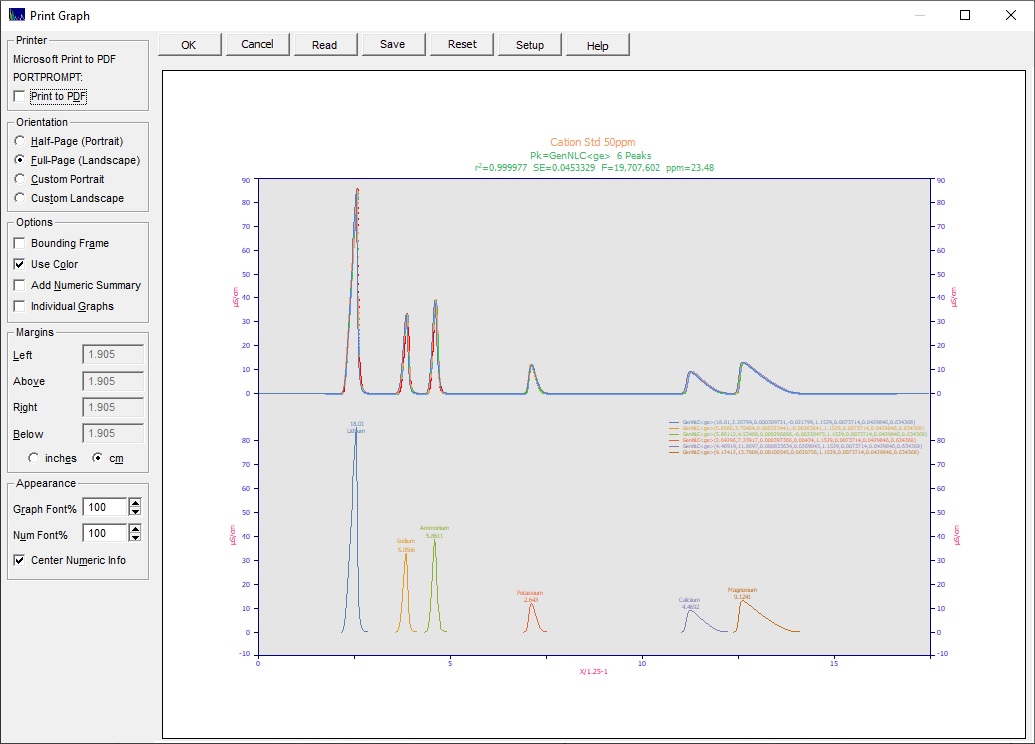
Graphs offer a full print preview. You can use this Print Graph option to print a half-page,
full-page, or custom size graph. You can also add the numeric summary to the printed output, and print
individual graphs when there are multiple data sets. It is also a easy matter to print directly to a PDF.
PeakLab
Graphs offer a full print preview. You can use this Print Graph option to print a half-page,
full-page, or custom size graph. You can also add the numeric summary to the printed output, and print
individual graphs when there are multiple data sets. It is also a easy matter to print directly to a PDF.

The dialog will contain a preview image of the graph, rendering the image to be printed as accurately as possible. This preview graph will be updated as orientations are changed, options are selected, margins are set, and font scalings changed.
Print to PDF
If the "MS Print to PDF" is available (Windows 10), you can check Print to PDF to have the print directly routed to a PDF file.
Orientation
There are four Orientations from which to choose:
Half-Page (Portrait) - the margins are automatically determined
Full-Page (Landscape) - the margins are automatically determined
Custom Portrait - the margins must be specified
Custom Landscape - the margins must be specified
Options
Bounding Frame
You may elect to print a bounding frame around the graph by checking the Bounding Frame option.
Use Color
You may print the graph in color by checking the Use Color item. Note that black and white graphs can be printed regardless of the current color scheme. PeakLab internally uses the Page White BW color scheme for monochrome printing.
Add Numeric Summary
This option prints the Numeric Summary for the fit immediately after the graph. If multiple fits are being printed in a single matrix of graphs, the Numeric Summary for all fits is printed after the graph. This option will only be available within PeakLab's Review.
Individual Graphs
If this option is checked, the fits are printed separately, one full size graph per fit, and if the Add Numeric Summary is checked, the individual Numeric Summary is printed after the graph. This option will only be available when multiple graphs are present.
Margins
If you wish to print a custom portrait or landscape graph, you must specify the four margins which define the boundaries of the graph. You can do so in inches or centimeters.
Appearance
Graph Font %
In some instances, PeakLab may use a larger screen font to maintain legibility in graphs. If this Print Preview indicates the need to increase or decrease the overall font scaling, you may enter a different value in the Font % field. You may also use the spin buttons to change this value or you may select the value from a popup menu activated by holding the right mouse button down when over the field or spin buttons.
Line Width
With high resolution output devices, the single width lines used by default for drawing peaks may appear too light. These lines can be darkened by increasing the line width in the Graph View option.
Num Font %
In some instances, the Numeric Summary text may overflow the page width. This Num Font% option changes the font scaling for the font used specifically in the Numeric Summary.
Center Numeric Info
When possible, the Center Numeric Info option will center the Numeric Summary in the printed output.
Save Custom Settings
You may Save a custom print file containing the current information. This custom print graph file will have a default [CPG] extension.
Read Custom Settings
Use the Read option to import a custom print settings from a custom print [CPG] file.
Printer Setup
To select a given printer, use the Setup button. When you select a printer, you will also have the option to modify the printer driver's own dialog, as in the case of setting printer resolution, paper size, and printing multiple copies.
Initiating the Print
Simply press OK to begin the printing, or Cancel to abandon printing. Once printing begins, there will be a brief time where a print job can be canceled during the Windows spooling operation. After that time, a print job must be canceled from Windows Print Manager.
Driver Problems
For some older printer drivers, you may need to set the orientation within the printer setup dialog.
PeakLab Graphs use a special procedure for producing enhanced grid lines which look very good with digital devices. For certain printers you may need to set a Grid Level of 0 (a pure line) in order for grids to appear.


 |