PeakLab v1 Documentation Contents AIST Software Home AIST Software Support
Fourier Domain Filtering
![]() This Fourier Filter option is available from the Graphically Adjust the Fourier Domain Filter button
in the Fourier Filter section of the IRF
Deconvolution procedure. In this case, the filtering is applied in-situ in the deconvolution preprocessing
step. The data level arising from this procedure will consist of an IRF Deconvolution with a noise filter.
This Fourier Filter option is available from the Graphically Adjust the Fourier Domain Filter button
in the Fourier Filter section of the IRF
Deconvolution procedure. In this case, the filtering is applied in-situ in the deconvolution preprocessing
step. The data level arising from this procedure will consist of an IRF Deconvolution with a noise filter.
This Fourier Filter procedure is also available as a separate smoothing or denoising step in the Fourier Denoising item in the main window Data menu. In this instance the data level will consist specifically of a Fourier denoising filtering.

Threshold
The following Fourier Filter threshold options are available:
None - used only to display the Fourier transform of the data
Frequency - sets a frequency threshold beyond which are all channels are zeroed
dB Norm - sets a normalized decibel value for the Fourier spectrum where all channels are zeroed
which are below this dB value
% Channels - zeroes a fixed percentage of upper frequency channels
D2 Automatic - generates a smooth second derivative signal of the power spectrum where the
threshold is automatically determined by a second derivative peak
The Frequency field specifies the value for this option's actual Fourier domain frequency (x scale). Beyond this frequency value, all channels are zeroed in the inverse.
The dB Norm field specifies the value to for this option's normalized dB (y-scale). The dB normalized scale is always from 0 as a maximum, so all of the values in the power spectrum will be negative. When you specify a value of 100 dB, you are specifying a 100 dB difference, that all channels with a value below -100 dB should be zeroed in the inverse.
The % Channels field specifies the percentage of upper frequency channels to zero. A value of 80% would zero the upper 8/10 of the frequency channels.
The D2 %Smoothing field creates a second derivative using the Savitzky-Golay smoothing algorithm with this % level of smoothing. After a specified decay in the spectrum has occurred, the first peak in the second derivative of the power spectrum is used as the frequency threshold for zeroing. This will often find a close to optimum filter for deconvolution noise filtering.
Interactive Threshold Selection
When Frequency is selected, you can click at any point in the graph. The x (frequency) value of that click is used as the frequency threshold.
When dB Norm is selected, you can also click at any point in the graph. Here the y (dB) value of that click is used as the decibel threshold.
If either % Channels or D2 Automatic is selected, there is no interactive threshold selection.
Copying, Saving, or Listing the Fourier Spectrum
![]() The Copy option will copy all data in the graph(s), both time and frequency domain, to the clipboard.
If multiple sets are present, the information from all data sets will be copied. This can be a very large
block of information. To copy the information from just a single data set, double click that graph (or
right click this graph and select Plot this Data Set from the popup menu) so that only the data
set you wish is graphed. Click Copy and only the information from this data set will be placed
on the clipboard. Note that there is also a separate Copy Graph to Clipboard option in the toolbar
of the graph. While this is mostly used to copy the graphs, it also offers a general Numeric Info
option that extracts the numeric information from the graphs and places such on the clipboard.
The Copy option will copy all data in the graph(s), both time and frequency domain, to the clipboard.
If multiple sets are present, the information from all data sets will be copied. This can be a very large
block of information. To copy the information from just a single data set, double click that graph (or
right click this graph and select Plot this Data Set from the popup menu) so that only the data
set you wish is graphed. Click Copy and only the information from this data set will be placed
on the clipboard. Note that there is also a separate Copy Graph to Clipboard option in the toolbar
of the graph. While this is mostly used to copy the graphs, it also offers a general Numeric Info
option that extracts the numeric information from the graphs and places such on the clipboard.
![]() The Save option will save all data in the graph(s), both time and frequency domain, to either a
comma delimited (csv), tab delimited (prn), or space delimited (txt) ASCII file. If multiple sets are
present, the information from all data sets will be saved. This can be quite a large file. To save the
information from just a single data set, double click that graph (or right click this graph and select
Plot this Data Set from the popup menu) so that only the data set you wish is graphed. Click Save
and only the information from this data set will be saved to the file.
The Save option will save all data in the graph(s), both time and frequency domain, to either a
comma delimited (csv), tab delimited (prn), or space delimited (txt) ASCII file. If multiple sets are
present, the information from all data sets will be saved. This can be quite a large file. To save the
information from just a single data set, double click that graph (or right click this graph and select
Plot this Data Set from the popup menu) so that only the data set you wish is graphed. Click Save
and only the information from this data set will be saved to the file.
![]() The List option opens a text
viewer that lists the numeric information in a graph. Only one graph's information is displayed, the
Data Set specified in the field in the Filter Stats section. To list only the data for a specific
graph, select the data set in this field, or double click that graph (or right click this graph and select
Plot this Data Set from the popup menu). Clicking List will then display the information
for this data set. When the List is open, all other operations are disabled. You will need to close the
List option window before proceeding.
The List option opens a text
viewer that lists the numeric information in a graph. Only one graph's information is displayed, the
Data Set specified in the field in the Filter Stats section. To list only the data for a specific
graph, select the data set in this field, or double click that graph (or right click this graph and select
Plot this Data Set from the popup menu). Clicking List will then display the information
for this data set. When the List is open, all other operations are disabled. You will need to close the
List option window before proceeding.
Filter Stats
The stats for the filtering are shown for the selected data set.
To see the states for a specific data set, use the Data Set field to select the data set of interest. You can also double click that graph (or right click this graph and select Plot this Data Set from the popup menu) in order to select the data set you wish.
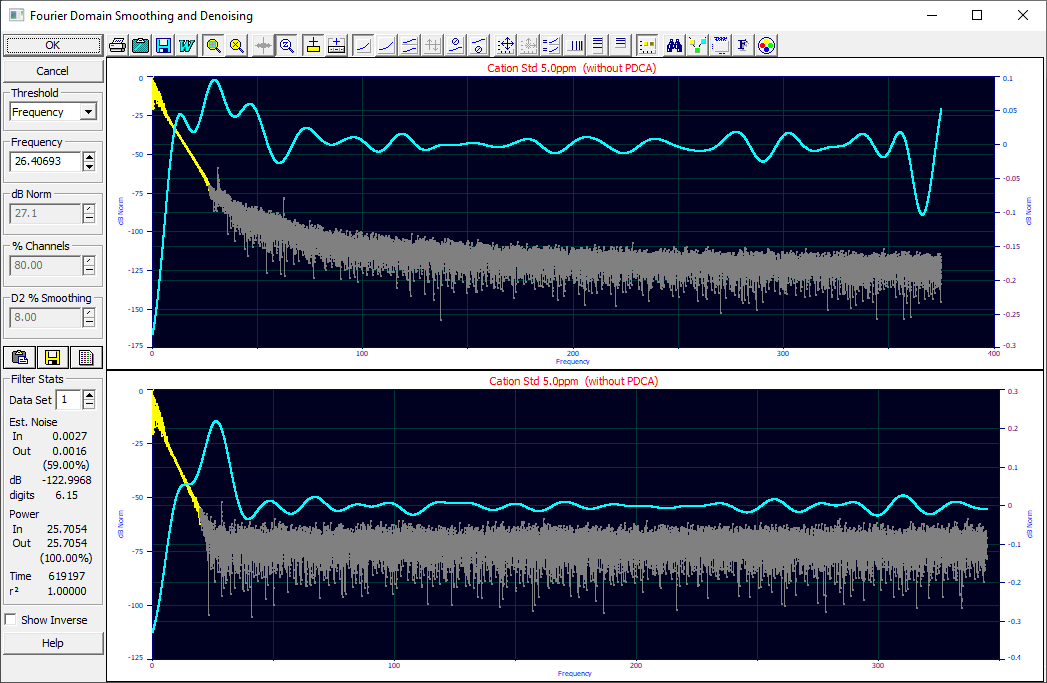
An estimated absolute Gaussian noise percent before and after, and also as a percent of the incoming noise, are given as well as the overall estimate of the precision in the data as a noise floor dB and as the number of significant digits. This should be deemed the threshold where all signal is lost, and only noise remains. In general, the signal degrades from the presence of noise appreciably sooner than this noise floor. If you look closely at the Fourier spectra above it can be quite apparent where the noise begins to appear.
Since this is a Fourier power spectrum, the power in and out is also displayed as well as the percent of power with respect to the incoming signal. The power in a frequency spectrum will be proportional to the square of the amplitude. Sharpening the peak in a deconvolution will increase the power. If the deconvolution becomes negative at various points, the signal at such points will also be squared, positive, and add to the power.
The r2 is useful for displaying the measure to which the filtering is altering the incoming data. The more the incoming data is sharpened, the more the r2 will deviate from 1.0.
For most high S/N chromatographic data, you will want to see close to 100.00% of the power and an r2 coefficient of determination close to 1.00000 between the incoming and filtered data. If not, you may be discarding signal and introducing a bias in the data from the noise filtration.
Show Inverse
For chromatographic data with strong S/N, the inverse may be visually indistinguishable from the incoming data. You may need to zoom-in the graph to see differences.
Multiple Data Sets
If you have multiple data sets present, all will be shown in this procedure, irrespective of whether or not a data set is selected in the main window of the program. The data set selection in the main screen applies only to the View and Compare Data options and the Local Maxima Peaks, Hidden Peaks - Residuals, and the Hidden Peaks - Second Derivative fitting options.
When the OK is selected with all data sets shown, all of the data sets will be preprocessed with the filter specified. If you wish to employ a custom Fourier filtration on one or more of the data sets, you should first apply the filter for most of the data sets, and only then double click that graph (or right click and select the Plot This Data Set option from the popup menu) to filter that specific data set.
After adjusting a given set, you can click OK, double click the graph, or right click the graph and choose Plot All Data Sets from the popup menu. Clicking OK when you are within a single plot returns you to the dialog with all data sets rendered.
If you have made one or more custom filtrations, note that only the overall filter settings are saved in the data level description in the PFD file.
When all graphs are shown and a new thresholding is made, you will be asked to confirm the discard of any custom filtrations you have made.
PeakLab Graph
All of the graph options are available in the PeakLab graph which is used throughout the program. There will be two sets of graphs, one frequency domain, one time domain, each with a separate set of toolbars, if the Show Inverse is checked.
Right Click Menu Options
When you right click a graph a popup menu will offer the following options:
Restore Scaling - Undo Zoom
If you have zoomed in the graphs, this option can be used to undo the zoom-in and restore the automatic scaling.
![]() If the Zoom-In Applies to All Graphs is selected in the toolbar, the zoom will apply to all graphs
controlled by that toolbar. Both the x-range and y-range of the zoomed graph will be transferred to all
of the other graphs.
If the Zoom-In Applies to All Graphs is selected in the toolbar, the zoom will apply to all graphs
controlled by that toolbar. Both the x-range and y-range of the zoomed graph will be transferred to all
of the other graphs.
![]() If the Zoom-In Applies to All Graphs, X-scaling only is selected in the toolbar, the zoom will
apply to all graphs controlled by that toolbar, but only the x-range will be transferred to the other
graphs.
If the Zoom-In Applies to All Graphs, X-scaling only is selected in the toolbar, the zoom will
apply to all graphs controlled by that toolbar, but only the x-range will be transferred to the other
graphs.
If neither option is selected, the zoom will apply only to the one graph where the zoom was made.
Plot this Data Set
Use this right-click menu option to view or independently filter just one of the data sets. When this option is used, the filtering will apply to just this one data set. You can use any option for the filtering, any value, and for the Frequency and dB Norm thresholds, you can graphically set the filter by clicking at the desired frequency or normalized dB threshold in the graph. If a separate filtering is made, this is considered a 'local' filtering where the algorithm and filter parameter are not saved in the PeakLab PFD data file. When local Fourier filtrations are being used, you will need to confirm such upon exiting the procedure.
Plot All Data Sets
You can use this right-click option to close a local filtering step. You can also close the local filtering by clicking OK-the dialog is restored to where all data sets are shown. You can also double click the graph to restore all data plots. In all cases, the locally filtered data will be preserved.
Fourier Domain Editing (Advanced)
![]() The Manual Sectioning Mode in the toolbar can be used if you are locally filtering a single data
set. This option will be disabled if multiple data sets are graphed in the main window. When this mode
is selected, the zoom and interactive threshold selection is disabled. Click and hold the left mouse button
sliding left to activate frequency channels (the channels will appear in the current point color), and
right to zero them (the channels will be grayed).
The Manual Sectioning Mode in the toolbar can be used if you are locally filtering a single data
set. This option will be disabled if multiple data sets are graphed in the main window. When this mode
is selected, the zoom and interactive threshold selection is disabled. Click and hold the left mouse button
sliding left to activate frequency channels (the channels will appear in the current point color), and
right to zero them (the channels will be grayed).
Deconvolution and Noise
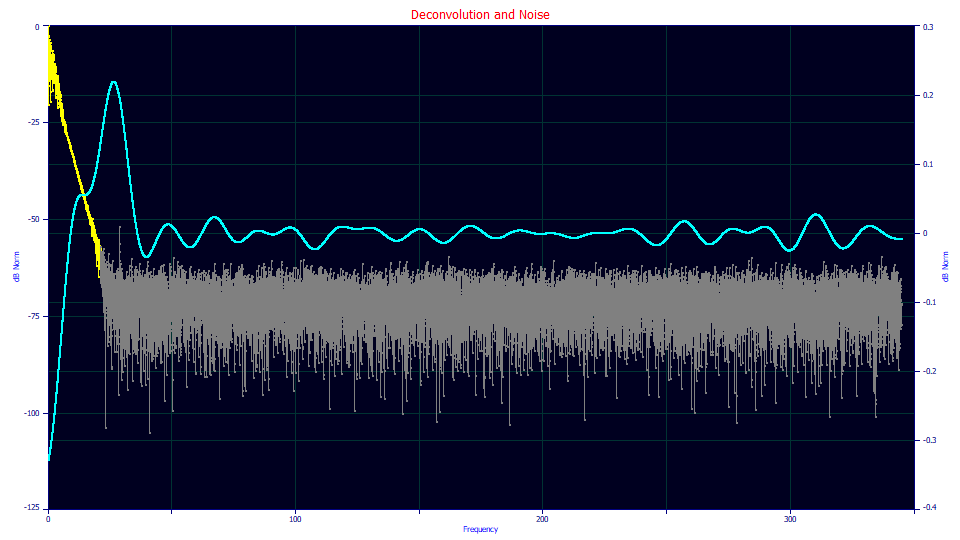
Fourier Deconvolution introduces noise in the signal. Unless you have very clean data with very little noise, you will probably use a filter to zero higher frequency or lower dB channels to reduce the noise in the deconvolved signal.

This is the Fourier domain spectrum of a chromatogram with a specific level of noise. This Fourier Domain Filtering option when invoked from the main menu estimates 0.93% Gaussian noise, a -71.7 dB noise floor, and a total loss of precision at 3.6 significant figures. By filtering the data as above, the noise is reduced to .0016% (.17% of the incoming).

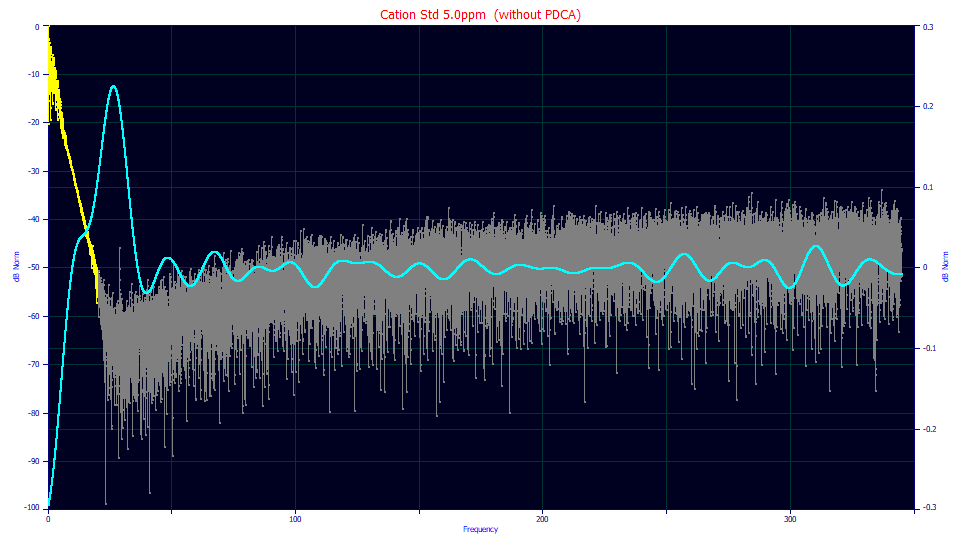
This is the Fourier spectrum for the same data after the IRF has been deconvolved. This is what you will see if you click the Graphically Adjust the Fourier Domain Filter button in the IRF Deconvolution procedure. Note that the noise increases with frequency. In a Fourier power spectrum, the difference of 20 dB is one order of magnitude. Here the filter is still successful, .0018% noise in the inverse (.20% of the incoming noise). With the deconvolution in the Fourier domain, the noise floor rises to -46.1 dB, with a total loss of precision at 2.3 significant figures.
Whether you are filtering data directly to improve the S/N, or whether you are filtering to minimize noise in a deconvolution, the point you want to set is similar to the thresholds in the plots above.
The blue curve in the plots above above is a smooth second derivative of the Fourier spectrum. After a certain decay in the spectrum's signal, the first peak in this second derivative will occur very close to the optimal threshold. The automated algorithm looks for the first peak in this second derivative after the spectrum crosses 1/2 the dB of the noise floor. If the noise floor is at -100 dB, the first peak after the spectrum has fallen below -50 dB is taken as the filter frequency threshold.

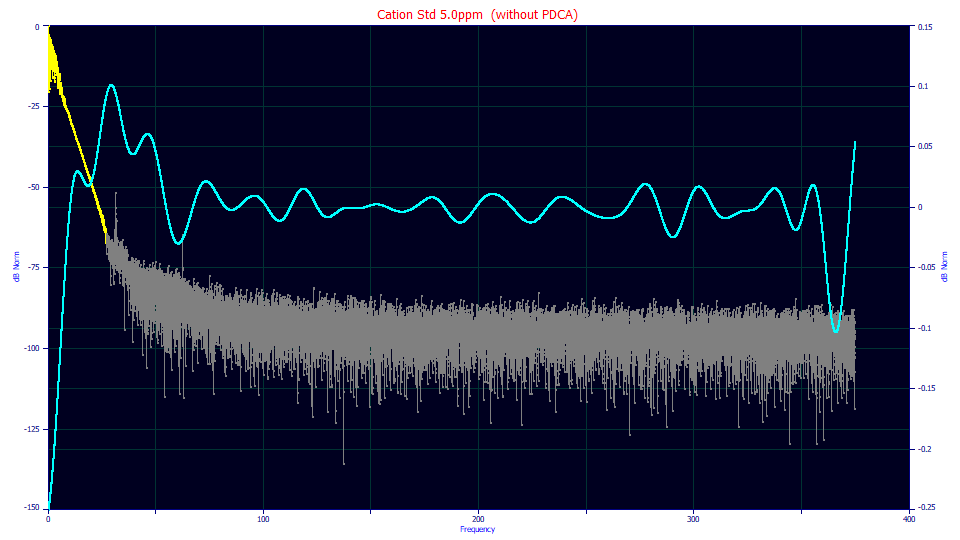
If you have very high S/N data, the benefits of filtering may not be easily recognized. This is the Fourier domain deconvolution of raw data with a -123 dB noise floor. The noise floor after the deconvolution rises to -96.7 dB and the raw data noise of just .0027%, increased to .0356% by the deconvolution, is reduced to .0018% by the filter shown above. If your data are of this quality, you may find it easiest to use the D2 automatic filter. With the D2 filter option you only need to specify a smoothing level sufficient to realize a respectable second derivative curve.


 |